MapReduce framework

 Hadoop HDFS stores the data, MapReduce processes the data stored in HDFS, and YARN divides the tasks and assigns resources.
  •  MapReduce is a software framework and programming model that allows us to perform distributed and parallel processing on large data sets in a distributed environment
  • It is the processing unit in Hadoop.
  • MapReduce consists of two distinct tasks – Map and Reduce 
  •  It works by dividing the task into independent subtasks and executes them in parallel across various DataNodes thereby increasing the throughput,fially
  • Map tasks deal with splitting and mapping of data while Reduce tasks shuffle and reduce the data. 
  • Hadoop is capable of running MapReduce programs written in various languages: Java, Ruby, Python, and C++. 
  • The input to each phase is key-value pairs.  The type of key, value pairs is specified by the programmer through the InputFormat class. By default, the text input format is used. 
  • The first is the map job, where a block of data is read and processed to produce key-value pairs as intermediate outputs.
  • The output of a Mapper or map job (key-value pairs) is input to the Reducer.
  • The reducer receives the key-value pair from multiple map jobs.
  • Then, the reducer aggregates those intermediate data tuples (intermediate key-value pair) into a smaller set of tuples or key-value pairs which is the final output.

MapReduce Architecture

Basic strategy: divide & conquer
Partition a large problem into smaller subproblems, to the extent that subproblems are independent.

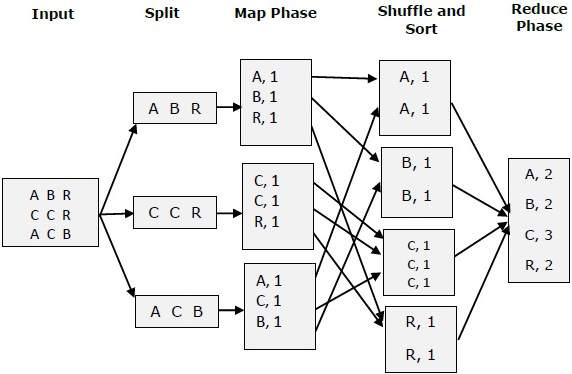
The whole process goes through four phases of execution namely, splitting, mapping, shuffling, and reducing.

MapReduce Way - MapReduce Tutorial - Edureka 


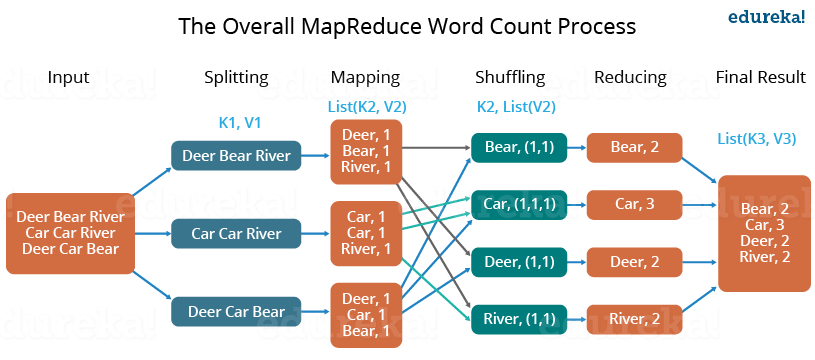
The data goes through the following phases of MapReduce in Big Data

Spliting

An input to a MapReduce in Big Data job is divided into fixed-size pieces called input splits Input split is a chunk of the input that is consumed by a single map

Mapping

  • This is the very first phase in the execution of map-reduce program. 
  • In this phase data in each split is passed to a mapping function to produce output values.

Shuffling

  • This phase consumes the output of Mapping phase. 
  • Its task is to consolidate the relevant records from Mapping phase output. 
  • In our example, the same words are clubbed together along with their respective frequency.

Reducing

  • In this phase, output values from the Shuffling phase are aggregated.
  • This phase combines values from Shuffling phase and returns a single output value. 
  • In short, this phase summarizes the complete dataset.

 MapReduce Work

How MapReduce Organizes Work?

Hadoop divides the job into tasks. There are two types of tasks:

  1. Map tasks (Splits & Mapping)
  2. Reduce tasks (Shuffling, Reducing)

The complete execution process (execution of Map and Reduce tasks, both) is controlled by two types of entities called a

  1. Jobtracker: Acts like a master (responsible for complete execution of submitted job)
  2. Multiple Task Trackers: Acts like slaves, each of them performing the job

For every job submitted for execution in the system, there is one Jobtracker that resides on Namenode and there are multiple tasktrackers which reside on Datanode.

How Hadoop MapReduce Works
 
Working of Hadoop MapReduce
  • A job is divided into multiple tasks which are then run onto multiple data nodes in a cluster.
  • It is the responsibility of job tracker to coordinate the activity by scheduling tasks to run on different data nodes.
  • Execution of individual task is then to look after by task tracker, which resides on every data node executing part of the job.
  • Task tracker's responsibility is to send the progress report to the job tracker.
  • In addition, task tracker periodically sends 'heartbeat' signal to the Jobtracker so as to notify him of the current state of the system. 
  • Thus job tracker keeps track of the overall progress of each job. In the event of task failure, the job tracker can reschedule it on a different task tracker.

Advantages of MapReduce

The two biggest advantages of MapReduce are:

      1. Parallel Processing:

In MapReduce, we are dividing the job among multiple nodes and each node works with a part of the job simultaneously. So, MapReduce is based on Divide and Conquer paradigm which helps us to process the data using different machines. As the data is processed by multiple machines instead of a single machine in parallel, the time taken to process the data gets reduced by a tremendous amount

2. Data Locality: 

Instead of moving data to the processing unit, we are moving the processing unit to the data in the MapReduce Framework.  In the traditional system, we used to bring data to the processing unit and process it. But, as the data grew and became very huge, bringing this huge amount of data to the processing unit posed the following issues: 

  • Moving huge data to processing is costly and deteriorates the network performance. 
  • Processing takes time as the data is processed by a single unit which becomes the bottleneck.
  • The master node can get over-burdened and may fail.  

Now, MapReduce allows us to overcome the above issues by bringing the processing unit to the data. So, as you can see in the above image that the data is distributed among multiple nodes where each node processes the part of the data residing on it. This allows us to have the following advantages:

  • It is very cost-effective to move processing unit to the data.
  • The processing time is reduced as all the nodes are working with their part of the data in parallel.
  • Every node gets a part of the data to process and therefore, there is no chance of a node getting overburdened.
Why MapReduce?

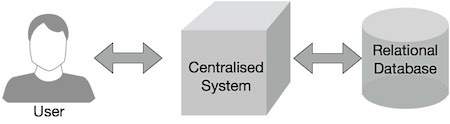
Traditional Enterprise Systems normally have a centralized server to store and process data. The following illustration depicts a schematic view of a traditional enterprise system. Traditional model is certainly not suitable to process huge volumes of scalable data and cannot be accommodated by standard database servers. Moreover, the centralized system creates too much of a bottleneck while processing multiple files simultaneously.

Traditional Enterprise System View

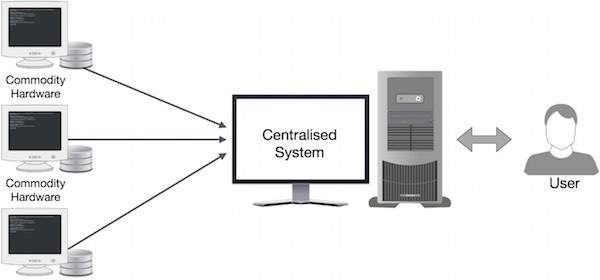
Google solved this bottleneck issue using an algorithm called MapReduce. MapReduce divides a task into small parts and assigns them to many computers. Later, the results are collected at one place and integrated to form the result dataset.

Centralized System

MapReduce-Example

Let us take a real-world example to comprehend the power of MapReduce. Twitter receives around 500 million tweets per day, which is nearly 3000 tweets per second. The following illustration shows how Tweeter manages its tweets with the help of MapReduce.

MapReduce Example

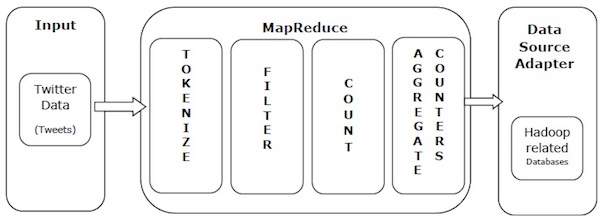
As shown in the illustration, the MapReduce algorithm performs the following actions −

  • Tokenize − Tokenizes the tweets into maps of tokens and writes them as key-value pairs.

  • Filter − Filters unwanted words from the maps of tokens and writes the filtered maps as key-value pairs.

  • Count − Generates a token counter per word.

  • Aggregate Counters − Prepares an aggregate of similar counter values into small manageable units.

MapReduce - Algorithm

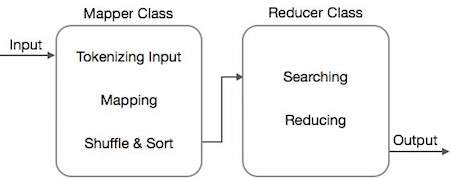
The MapReduce algorithm contains two important tasks, namely Map and Reduce.

  • The map task is done by means of Mapper Class
  • The reduce task is done by means of Reducer Class.

Mapper class takes the input, tokenizes it, maps and sorts it. The output of Mapper class is used as input by Reducer class, which in turn searches matching pairs and reduces them.

Mapper Reducer Class

MapReduce implements various mathematical algorithms to divide a task into small parts and assign them to multiple systems. In technical terms, MapReduce algorithm helps in sending the Map & Reduce tasks to appropriate servers in a cluster.

These mathematical algorithms may include the following −

  • Sorting
  • Searching
  • Indexing
  • TF-IDF

Sorting

Sorting is one of the basic MapReduce algorithms to process and analyze data. MapReduce implements sorting algorithm to automatically sort the output key-value pairs from the mapper by their keys.

  • Sorting methods are implemented in the mapper class itself.

  • In the Shuffle and Sort phase, after tokenizing the values in the mapper class, the Context class (user-defined class) collects the matching valued keys as a collection.

  • To collect similar key-value pairs (intermediate keys), the Mapper class takes the help of RawComparator class to sort the key-value pairs.

  • The set of intermediate key-value pairs for a given Reducer is automatically sorted by Hadoop to form key-values (K2, {V2, V2, …}) before they are presented to the Reducer.

Searching

Searching plays an important role in MapReduce algorithm. It helps in the combiner phase (optional) and in the Reducer phase. Let us try to understand how Searching works with the help of an example.

Example

The following example shows how MapReduce employs Searching algorithm to find out the details of the employee who draws the highest salary in a given employee dataset.

  • Let us assume we have employee data in four different files − A, B, C, and D. Let us also assume there are duplicate employee records in all four files because of importing the employee data from all database tables repeatedly. See the following illustration.

Map Reduce Illustration
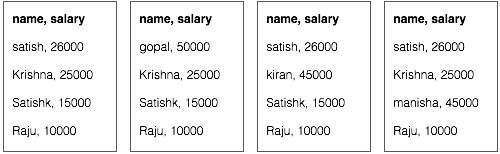
  • The Map phase processes each input file and provides the employee data in key-value pairs (<k, v> : <emp name, salary>). See the following illustration.

Map Reduce Illustration
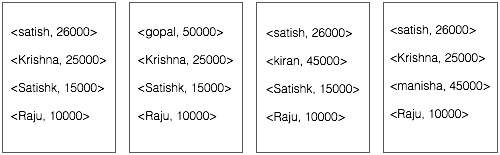
  • The combiner phase (searching technique) will accept the input from the Map phase as a key-value pair with employee name and salary. Using searching technique, the combiner will check all the employee salary to find the highest salaried employee in each file. See the following snippet.

<k: employee name, v: salary>
Max= the salary of an first employee. Treated as max salary

if(v(second employee).salary > Max){
   Max = v(salary);
}

else{
   Continue checking;
}

The expected result is as follows −

<satish, 26000>


<gopal, 50000>


<kiran, 45000>


<manisha, 45000>


  • Reducer phase − Form each file, you will find the highest salaried employee. To avoid redundancy, check all the <k, v> pairs and eliminate duplicate entries, if any. The same algorithm is used in between the four <k, v> pairs, which are coming from four input files. The final output should be as follows −

<gopal, 50000>

Indexing

Normally indexing is used to point to a particular data and its address. It performs batch indexing on the input files for a particular Mapper.

The indexing technique that is normally used in MapReduce is known as inverted index. Search engines like Google and Bing use inverted indexing technique. Let us try to understand how Indexing works with the help of a simple example.

Example

The following text is the input for inverted indexing. Here T[0], T[1], and t[2] are the file names and their content are in double quotes.

T[0] = "it is what it is"
T[1] = "what is it"
T[2] = "it is a banana"

After applying the Indexing algorithm, we get the following output −

"a": {2}
"banana": {2}
"is": {0, 1, 2}
"it": {0, 1, 2}
"what": {0, 1}

Here "a": {2} implies the term "a" appears in the T[2] file. Similarly, "is": {0, 1, 2} implies the term "is" appears in the files T[0], T[1], and T[2].

TF-IDF

TF-IDF is a text processing algorithm which is short for Term Frequency − Inverse Document Frequency. It is one of the common web analysis algorithms. Here, the term 'frequency' refers to the number of times a term appears in a document.

Term Frequency (TF)

It measures how frequently a particular term occurs in a document. It is calculated by the number of times a word appears in a document divided by the total number of words in that document.

TF(the) = (Number of times term the ‘the’ appears in a document) / (Total number of terms in the document)

Inverse Document Frequency (IDF)

It measures the importance of a term. It is calculated by the number of documents in the text database divided by the number of documents where a specific term appears.

While computing TF, all the terms are considered equally important. That means, TF counts the term frequency for normal words like “is”, “a”, “what”, etc. Thus we need to know the frequent terms while scaling up the rare ones, by computing the following −

IDF(the) = log_e(Total number of documents / Number of documents with term ‘the’ in it).

The algorithm is explained below with the help of a small example.

Example

Consider a document containing 1000 words, wherein the word hive appears 50 times. The TF for hive is then (50 / 1000) = 0.05.

Now, assume we have 10 million documents and the word hive appears in 1000 of these. Then, the IDF is calculated as log(10,000,000 / 1,000) = 4.

The TF-IDF weight is the product of these quantities − 0.05 × 4 = 0.20.


 REF

https://www.guru99.com/introduction-to-mapreduce.html 

Data Analytics Lifecycle

The Data Analytics Lifecycle is a cyclic process which explains, in six stages, how information in made, collected, processed, implemented, and analyzed for different objectives.


1. Data Discovery

  • This is the initial phase to set your project's objective
  • Start with defining your business domain and ensure you have enough resources (time, technology, data, and people) to achieve your goals.
  • The biggest challenge in this phase is to accumulate enough information. You need to draft an analytic plan, which requires some serious leg work.

Accumulate resources

First, you have to analyze the models you have intended to develop. Then determine how much domain knowledge you need to acquire for fulfilling those models.

The next important thing to do is assess whether you have enough skills and resources to bring your projects to fruition.

Frame the issue

Problems are most likely to occur while meeting your client's expectations. Therefore, you need to identify the issues related to the project and explain them to your clients. This process is called "framing." You have to prepare a problem statement explaining the current situation and challenges that can occur in the future. You also need to define the project's objective, including the success and failure criteria for the project.

Formulate initial hypothesis

Once you gather all the clients' requirements, you have to develop initial hypotheses after exploring the initial data.

2. Data Preparation and Processing

The Data preparation and processing phase involves collecting, processing, and conditioning data before moving to the model building process.

Identify data sources

You have to identify various data sources and analyze how much and what kind of data you can accumulate within a given time frame. Evaluate the data structures, explore their attributes and acquire all the tools needed.

Collection of data

You can collect data using three methods:

#Data acquisition: You can collect data through external sources.

#Data Entry: You can prepare data points through digital systems or manual entry as well.

#Signal reception: You can accumulate data from digital devices such as IoT devices and control systems.

3. Model Planning

This is a phase where you have to analyze the quality of data and find a suitable model for your project.

This phase needs the availability of an analytic sandbox for the team to work with data and perform analytics throughout the project duration. The team can load data in several ways.

Extract, Transform, Load (ETL) – It transforms the data based on a set of business rules before loading it into the sandbox.

Extract, Load, Transform (ELT) – It loads the data into the sandbox and then transforms it based on a set of business rules.

Extract, Transform, Load, Transform (ETLT) – It’s the combination of ETL and ELT and has two transformation levels.

An analytics sandbox is a part of data lake architecture that allows you to store and process large amounts of data. It can efficiently process a large range of data such as big data, transactional data, social media data, web data, and many more. It is an environment that allows your analysts to schedule and process data assets using the data tools of their choice. The best part of the analytics sandbox is its agility. It empowers analysts to process data in real-time and get essential information within a short duration.

4. Model Building

  • Model building is the process where you have to deploy the planned model in a real-time environment. 
  • It allows analysts to solidify their decision-making process by gain in-depth analytical information. This is a repetitive process, as you have to add new features as required by your customers constantly.
In this phase, the team develops testing, training, and production datasets. Further, the team builds and executes models meticulously as planned during the model planning phase. They test data and try to find out answers to the given objectives. They use various statistical modeling methods such as regression techniques, decision trees, random forest modeling, and neural networks and perform a trial run to determine whether it corresponds to the datasets.

5. Result Communication and Publication

This is the phase where you have to communicate the data analysis with your clients. It requires several intricate processes where you how to present information to clients in a lucid manner. Your clients don't have enough time to determine which data is essential. Therefore, you must do an impeccable job to grab the attention of your clients.

Check the data accuracy

Is the data provide information as expected? If not, then you have to run some other processes to resolve this issue. You need to ensure the data you process provides consistent information. This will help you build a convincing argument while summarizing your findings.

Highlight important findings

Well, each data holds a significant role in building an efficient project. However, some data inherits more potent information that can truly serve your audience's benefits. While summarizing your findings, try to categorize data into different key points.

Determine the most appropriate communication format

How you communicate your findings tells a lot about you as a professional. We recommend you to go for visuals presentation and animations as it helps you to convey information much faster. However, sometimes you also need to go old-school as well. For instance, your clients may have to carry the findings in physical format. They may also have to pick up certain information and share them with others.

6. Operationalize

As soon you prepare a detailed report including your key findings, documents, and briefings, your data analytics life cycle almost comes close to the end. The next step remains the measure the effectiveness of your analysis before submitting the final reports to your stakeholders.

In this process, you have to move the sandbox data and run it in a live environment. Then you have to closely monitor the results, ensuring they match with your expected goals. If the findings fit perfectly with your objective, then you can finalize the report. Otherwise, you have to take a step back in your data analytics lifecycle and make some changes.

 Data analytics roles and responsibilities

Hill climbing (M2.1)

  •  Hill climbing is a mathematical optimization technique. 
  • It is an iterative algorithm that starts with an arbitrary solution to a problem, then attempts to find a better solution by making an incremental change to the solution. If the change produces a better solution, another incremental change is made to the new solution, and so on until no further improvements can be found. 
  • It is a heuristic search (search algo. that may not find the optimal solution to the problem, but will give a good solution in reasonable time). Given a large set of inputs and a good heuristic function, it tries to find a sufficiently good solution to the problem. This solution may not be the global optimal maximum. (local search algo.)
A heuristic function is a function that will rank all the possible alternatives at any branching step in search algorithm based on the available information. It helps the algorithm to select the best route out of possible routes.
  • Hill climbing finds optimal solutions for convex problems – for other problems it will find only local optima (solutions that cannot be improved upon by any neighboring configurations), which are not necessarily the best possible solution (the global optimum) out of all possible solutions (the search space). 

For example, hill climbing can be applied to the traveling salesman problem. It is easy to find an initial solution that visits all the cities but will likely be very poor compared to the optimal solution. The algorithm starts with such a solution and makes small improvements to it, such as switching the order in which two cities are visited. Eventually, a much shorter route is likely to be obtained.  

Features of Hill Climbing

1. Variant of generate and test algorithm : It is a variant of generate and test algorithm. The generate and test algorithm is as follows : 

1. Generate possible solutions. 
2. Test to see if this is the expected solution. 
3. If the solution has been found quit else go to step 1.

Hence we call Hill climbing as a variant of generate and test algorithm as it takes the feedback from the test procedure. Then this feedback is utilized by the generator in deciding the next move in search space. 

2. Uses the Greedy approach : At any point in state space, the search moves in that direction only which optimizes the cost of function with the hope of finding the optimal solution at the end. 

3. No backtracking: It does not backtrack the search space, as it does not remember the previous states.

Mathematical description

Hill climbing attempts to maximize (or minimize) a target function , where is a vector of continuous and/or discrete values. At each iteration, hill climbing will adjust a single element in and determine whether the change improves the value of . (Note that this differs from gradient descent methods, which adjust all of the values in at each iteration according to the gradient of the hill.) With hill climbing, any change that improves is accepted, and the process continues until no change can be found to improve the value of . Then is said to be "locally optimal".

In discrete vector spaces, each possible value for may be visualized as a vertex in a graph. Hill climbing will follow the graph from vertex to vertex, always locally increasing (or decreasing) the value of , until a local maximum (or local minimum) is reached.


Types of Hill Climbing 

1. In Simple hill climbing, the first closer node is chosen.

2. In steepest ascent hill climbing all successors are compared and the closest to the solution is chosen. Steepest ascent hill climbing is similar to best-first search, which tries all possible extensions of the current path instead of only one.

(Both forms fail if there is no closer node, which may happen if there are local maxima in the search space which are not solutions.)

3. Stochastic hill climbing does not examine all neighbors before deciding how to move. Rather, it selects a neighbor at random, and decides (based on the amount of improvement in that neighbor) whether to move to that neighbor or to examine another.


#Simple Hill climbing 

It examines the neighboring nodes one by one and selects the first neighboring node which optimizes the current cost as next node. 

It only checks it's one successor state, and if it finds better than the current state, then move else be in the same state.

  • Less time consuming
  • Less optimal solution and the solution is not guaranteed

 Algorithm for Simple Hill climbing

Step 1 : Evaluate the initial state. If it is a goal state then stop and return success. Otherwise, make initial state as current state. 

Step 2 : Loop until the solution state is found or there are no new operators present which can be applied to the current state. 

a) Select a state that has not been yet applied to the current state and apply it to produce a new state. 

b) Perform these to evaluate new state 

  •  If the current state is a goal state, then stop and return success. 
  • If it is better than the current state, then make it current state and proceed further.  
  • If it is not better than the current state, then continue in the loop until a solution is found. 

Step 3 : Exit.  


#Steepest-Ascent Hill climbing

It first examines all the neighboring nodes and then selects the node closest to the solution state as of next node.

Algorithm

Step 1 :  Evaluate the initial state. If it is a goal state then stop and return success. Otherwise, make initial state as current state. 

Step 2 : Repeat these steps until a solution is found or current state does not change 

a) Select a state that has not been yet applied to the current state.

b)  Initialize a new ‘best state’ equal to current state and apply it to produce a new state.

c) Perform these to evaluate new state 
  •  If the current state is a goal state, then stop and return success.         
  • If it is better then best state, then make it best state else continue loop with another new state.

d) Make best state as current state and go to Step 2: b) part.

Step 3 : Exit


#Stochastic hill climbing 

 It does not examine all the neighboring nodes before deciding which node to select .It just selects a neighboring node at random and decides (based on the amount of improvement in that neighbor) whether to move to that neighbor or to examine another. 

Algorithm  

Step 1:  Evaluate the initial state. If it is a goal state then stop and return success. Otherwise, make initial state as current state. 

Step 2: Repeat these steps until a solution is found or current state does not change.

       a) Select a state that has not been yet applied to the current state.

       b) Apply successor function to the current state and generate all the neighbor states.

       c) Among the generated neighbor states which are better than current state choose a state randomly (or  based on some probability function).                                                                                                      

       d) If the chosen state is goal state, then return success, else make it current state and repeat step 2: b) part. 

Step 3: Exit

State Space diagram for Hill Climbing

State space diagram is a graphical representation of the set of states our search algorithm can reach vs the value of our objective function(the function which we wish to maximize). 


X-axis : denotes the state space ie states or configuration our algorithm may reach.
Y-axis : denotes the values of objective function corresponding to a particular state. 


The best solution will be that state space where objective function has maximum value(global maximum). 

State Space diagram for Hill climbing


Different regions in the State Space Diagram: 

  1. Local maximum: It is a state which is better than its neighboring state however there exists a state which is better than it(global maximum). This state is better because here the value of the objective function is higher than its neighbors. 
     
  2. Global maximum : It is the best possible state in the state space diagram. This because at this state, objective function has highest value.
  3. Plateau/flat local maximum : It is a flat region of state space where neighboring states have the same value.
  4. Ridge : It is region which is higher than its neighbours but itself has a slope. It is a special kind of local maximum.
  5. Current state : The region of state space diagram where we are currently present during the search.
  6. Shoulder : It is a plateau that has an uphill edge.

Problems in different regions in Hill climbing

Hill climbing cannot reach the optimal/best state(global maximum) if it enters any of the following regions :   

#Local maximum 

At a local maximum all neighboring states have a values which is worse than the current state. Since hill-climbing uses a greedy approach, it will not move to the worse state and terminate itself. The process will end even though a better solution may exist. 

To overcome local maximum problem : Backtracking technique can be a solution of the local maximum in state space landscape. Create a list of the promising path so that the algorithm can backtrack the search space and explore other paths as well.

#Plateau 

(On plateau all neighbors have same value . Hence, it is not possible to select the best direction.)

Another problem that sometimes occurs with hill climbing is that of a plateau. 

A plateau is encountered when the search space is flat, or sufficiently flat that the value returned by the target function is indistinguishable from the value returned for nearby regions due to the precision used by the machine to represent its value. In such cases, the hill climber may not be able to determine in which direction it should step, and may wander in a direction that never leads to improvement.

To overcome plateaus : Take a big jump or big steps. Randomly select a state far away from the current state. Chances are that we will land at a non-plateau region. 

#Ridge 

Any point on a ridge can look like peak because movement in all possible directions is downward. Hence the algorithm stops when it reaches this state. 

Ridges are a challenging problem for hill climbers that optimize in continuous spaces. Because hill climbers only adjust one element in the vector at a time, each step will move in an axis-aligned direction. If the target function creates a narrow ridge that ascends in a non-axis-aligned direction (or if the goal is to minimize, a narrow alley that descends in a non-axis-aligned direction), then the hill climber can only ascend the ridge (or descend the alley) by zig-zagging. If the sides of the ridge (or alley) are very steep, then the hill climber may be forced to take very tiny steps as it zig-zags toward a better position. Thus, it may take an unreasonable length of time for it to ascend the ridge (or descend the alley).

By contrast, gradient descent methods can move in any direction that the ridge or alley may ascend or descend. Hence, gradient descent or the conjugate gradient method is generally preferred over hill climbing when the target function is differentiable. Hill climbers, however, have the advantage of not requiring the target function to be differentiable, so hill climbers may be preferred when the target function is complex.

To overcome Ridge : In this kind of obstacle, use two or more rules before testing. It implies moving in several directions at once.
With the use of bidirectional search, or by moving in different directions, we can improve this problem.

Applications of Hill Climbing Technique

Hill Climbing technique can be used to solve many problems, where the current state allows for an accurate evaluation function, such as Network-Flow, Traveling Salesman problem, 8-Queens problem, Integrated Circuit design, etc.

The hill-climbing algorithm can be applied in the following areas:

Marketing

A hill-climbing algorithm can help a marketing manager to develop the best marketing plans. This algorithm is widely used in solving Traveling-Salesman problems. It can help by optimizing the distance covered and improving the travel time of sales team members. The algorithm helps establish the local minima efficiently.

Robotics

Hill climbing is useful in the effective operation of robotics. It enhances the coordination of different systems and components in robots.

Job Scheduling

The hill climbing algorithm has also been applied in job scheduling. This is a process in which system resources are allocated to different tasks within a computer system. Job scheduling is achieved through the migration of jobs from one node to a neighboring node. A hill-climbing technique helps establish the right migration route.


Hill Climbing is used in inductive learning methods too. This technique is used in robotics for coordination among multiple robots in a team. There are many other problems where this technique is used.

INFORMATION RETRIEVAL 1&2Module

2016

Module I

1 a. What role does logical view of documents play in information retrieval?

The effective retrieval of relevant information is directly affected both by the user task and by the logical view of the documents adopted by the retrieval system, as we now discuss.  

Due to historical reasons, documents in a collection are frequently represented through a set of index terms or keywords. Such keywords might be extracted directly from the text of the document or might be specified by a human subject (as frequently done in the information sciences arena). No matter whether these representative keywords are derived automatically or generated by a specialist, they provide a logical view of the document.
Logical view of documents: the representation of documents and Web pages adopted by the system. The most common form is to represent the text of the document by a set of indexing terms or keywords. 

Modern computers are making it possible to represent a document by its full set of words. The retrieval system adopts a full text logical view (or representation) of the documents. With very large collections, however, even modern computers might have to reduce the set of representative keywords. This can be accomplished through the elimination of stopwords (such as articles and connectives), the use of stemming  (which reduces distinct words to their common grammatical root), and the identification of noun groups (which eliminates adjectives, adverbs, and verbs). Further, compression might be employed. These operations are called text operations  (or transformations). Text operations reduce the complexity of the document representation and allow moving the logical view from that of a full text to that of a set of index terms .

b.The vector space model of document retrieval uses the notion of an information space. How is term weighting used to position objects in the space? Why is term weighting important for effective document retrieval?

The Vector-Space Model (VSM) for Information Retrieval represents documents and queries as vectors of weights. Each weight is a measure of the importance of an index term in a document or a query, respectively.

Term weighting

  • Term weighting is a procedure that takes place during the text indexing process in order to assess the value of each term to the document. 
  • Term weighting is the assignment of numerical values to terms that represent their importance in a document in order to improve retrieval effectiveness []. 
  • Essentially it considers the relative importance of individual words in an information retrieval system, which can improve system effectiveness, since not all the terms in a given document collection are of equal importance. 
  • Weighing the terms is the means that enables the retrieval system to determine the importance of a given term in a certain document or a query. 
  • It is a crucial component of any information retrieval system, a component that has shown great potential for improving the retrieval effectiveness of an information retrieval system [].

Term weights for information retrieval are estimated using term's co-occurrence as a measure of term dependency between them. The weight of vertex in the document graph is calculated based on both local and global information of that vertex.

c. A new IR algorithm yields the following answer to query ql (relevant docs are marked with a bullet):
01. d425
02. d87
03. d56 .
04. d32
05. dl24

06. d615     11. d193
07. d512     l2.d7l5
08. d129.    13. d8l0
09. d4         14. d5
10. d130     15. d3.

(i) Explain the evaluation metrics for the system'
(ii) Give the formula for mean average precision (MAP), and illustrate the metric by calculating System's MAP.
(iii) Draw a precision-recall.curve for the system. Explain how you arrived at your result.  

2017

l.a An information retrieval evaluation measure is different from traditional evaluation.Why?

b Briefly explain the information retrieval process with a block diagram

Information retrieval (IR) may be defined as a software program that deals with the organization, storage, retrieval and evaluation of information from document repositories particularly textual information. The system assists users in finding the information they require but it does not explicitly return the answers of the questions. It informs the existence and location of documents that might consist of the required information. The documents that satisfy user’s requirement are called relevant documents. A perfect IR system will retrieve only relevant documents.

With the help of the following diagram, we can understand the process of information retrieval (IR) −

Relevant Output About Information

It is clear from the above diagram that a user who needs information will have to formulate a request in the form of query in natural language. Then the IR system will respond by retrieving the relevant output, in the form of documents, about the required information.

 The main goal of IR research is to develop a model for retrieving information from the repositories of documents.

Information Retrieval (IR) Model

Mathematically, models are used in many scientific areas having objective to understand some phenomenon in the real world. A model of information retrieval predicts and explains what a user will find in relevance to the given query. IR model is basically a pattern that defines the above-mentioned aspects of retrieval procedure and consists of the following −

  • A model for documents.

  • A model for queries.

  • A matching function that compares queries to documents.

Mathematically, a retrieval model consists of −

D − Representation for documents.

R − Representation for queries.

F − The modeling framework for D, Q along with relationship between them.

R (q,di) − A similarity function which orders the documents with respect to the query. It is also called ranking.

Types of Information Retrieval (IR) Model

An information model (IR) model can be classified into the following three models −

Classical IR Model

It is the simplest and easy to implement IR model. This model is based on mathematical knowledge that was easily recognized and understood as well. Boolean, Vector and Probabilistic are the three classical IR models.

Non-Classical IR Model

It is completely opposite to classical IR model. Such kind of IR models are based on principles other than similarity, probability, Boolean operations. Information logic model, situation theory model and interaction models are the examples of non-classical IR model.

Alternative IR Model

It is the enhancement of classical IR model making use of some specific techniques from some other fields. Cluster model, fuzzy model and latent semantic indexing (LSI) models are the example of alternative IR model.


c. Consider a document collection with 5 relevant documents. Find the recall and precision at each document retrieval and plot the Precision/Recall curve(use interpolation). table given.

2018

l.a Differentiate information retrieval from data retrieval


Information RetrievalData Retrieval
The softwarethe  program that deals with the organization, storage, retrieval, and evaluation of information from document repositories particularly textual information.Data retrieval deals with obtaining data from a database management system such as ODBMS. It is A process of identifying and retrieving the data from the database, based on the query provided by user or application.

Retrieves information about a subject.Determines the keywords in the user query and retrieves the data.
Small errors are likely to go unnoticed.A single error object means total failure.
Not always well structured and is semantically ambiguous.Has a well-defined structure and semantics.
Does not provide a solution to the user of the database system.Provides solutions to the user of the database system.
The results obtained are approximate matches.The results obtained are exact matches.
Results are ordered by relevance.Results are unordered by relevance.
It is a probabilistic model.It is a deterministic model.

 Information retrival system and PageRank algorithm

b Briefly explain the information retrieval process with a block diagram 


c Consider a document collection with 4 relevant documents. Find the recall and precision at each document retrieval and plot the Precision/Recall curve (use interpolation). table given////repeated

2019

l.a Compare the process of data retrieval and information retrieval. ///repeated

b. Write note on Recall and Precision for retrieval performance evaluation. Explain with a simple example why Recall or Precision alone is not enough to quantify the performance of IR System. Explain any two alternative measures which combine recall and precision to get a better performance evaluation.

c. Describe the Retrieval process with simple, generic software architecture.


To describe the retrieval process, we use a simple and generic software architecture as shown in Figure [*]. First of all, before the retrieval process can even be initiated, it is necessary to define the text database. This is usually done by the manager of the database, which specifies the following: (a) the documents to be used, (b) the operations to be performed on the text, and (c) the text model (i.e., the text structure and what elements can be retrieved). The text operations transform the original documents and generate a logical view of them.

Once the logical view of the documents is defined, the database manager (using the DB Manager Module) builds an index of the text. An index is a critical data structure because it allows fast searching over large volumes of data. Different index structures might be used, but the most popular one is the inverted file as indicated in Figure [*]. The resources (time and storage space) spent on defining the text database and building the index are amortized by querying the retrieval system many times.

  
Figure: The process of retrieving information (the numbers beside each box indicate the chapters that cover the corresponding topic).


Given that the document database is indexed, the retrieval process can be initiated. The user first specifies a user need which is then parsed and transformed by the same text operations applied to the text. Then, query operations might be applied before the actual query, which provides a system representation for the user need, is generated. The query is then processed to obtain the retrieved documents. Fast query processing is made possible by the index structure previously built.

Before been sent to the user, the retrieved documents are ranked according to a likelihood of relevance. The user then examines the set of ranked documents in the search for useful information. At this point, he might pinpoint a subset of the documents seen as definitely of interest and initiate a user feedback cycle. In such a cycle, the system uses the documents selected by the user to change the query formulation. Hopefully, this modified query is a better representation of the real user need.

The small numbers outside thelower right corner of various boxes in Figure [*] indicate the chapters in this book which discuss the respective subprocesses in detail. A brief introduction to each of these chapters can be found in section [*].

Consider now the user interfaces available with current information retrieval systems (including Web search engines and Web browsers). We first notice that the user almost never declares his information need. Instead, he is required to provide a direct representation for the query that the system will execute. Since most users have no knowledge of text and query operations, the query they provide is frequently inadequate. Therefore, it is not surprising to observe that poorly formulated queries lead to poor retrieval (as happens so often on the Web).


Module II

2a.Explain the effect of IDF and TF factors on inter cluster dissimilarity and intra cluster similarity.

b. Consider two documents Dl = (0.5, 0.8, 0.3) and D2 = (0'9' 0'4, 0'2) indexed by three terms' where the numbers represent term weights. Given the query q = (t.5, 1.0, 0) indexed by the same terms' find the cosine measures for the two documents' 


c.Boolean model is more a data retrieval model than an information retrieval model' Justify your answer with.an example.

2017

2.a What is the difference between stemming and lemmatization

Stemming and Lemmatization are Text Normalization (or sometimes called Word Normalization) techniques in the field of Natural Language Processing that are used to prepare text, words, and documents for further processing.

Stemming just removes or stems the last few characters of a word, often leading to incorrect meanings and spelling. Lemmatization considers the context and converts the word to its meaningful base form, which is called Lemma. Sometimes, the same word can have multiple different Lemmas


b. Consider a very small collection that consists the following three documents with the
given contents:
d1 : "Kerala Technological University results"
d2: "Calicut Universitv results"
d3: "Karnataka University results"

Rank the documents for the query "Kerala results" using vector model. Assume tf-idf
ranking scheme and length normalization.

c. What is a positional index? Explain the algorithm for proximity intersection of 6
postings lists pl and p2 


To enable faster phrase search performance and faster relevance ranking with the Phrase module, your project builds index data out of word positions. This is called positional indexing. ... Positional indexing improves the performance of multi-word phrase search, proximity search, and certain relevance ranking modules.

Steps to build a Positional Index

  • Fetch the document.
  • Remove stop words, stem the resulting words.
  • If the word is already present in the dictionary, add the document and the corresponding positions it appears in. Else, create a new entry.
  • Also update the freqency of the word for each document, as well as the no. of documents it appears in.


2018

2.a TF-IDF is a good measure for weighting index terms in vector space model. Justify.


  • In information retrieval, tf–idf, TF*IDF, or TFIDF, short for term frequency–inverse document frequency, is a numerical statistic that is intended to reflect how important a word is to a document in a collection or corpus. 
  • It is often used as a weighting factor in searches of information retrieval, text mining, and user modelling. 
  • The tf–idf value increases proportionally to the number of times a word appears in the document and is offset by the number of documents in the corpus that contain the word, which helps to adjust for the fact that some words appear more frequently in general. 
  • tf–idf is one of the most popular term-weighting schemes today. 
  •  A survey conducted in 2015 showed that 83% of text-based recommender systems in digital libraries use tf–idf.

Variations of the tf–idf weighting scheme are often used by search engines as a central tool in scoring and ranking a document's relevance given a user query. tf–idf can be successfully used for stop-words filtering in various subject fields, including text summarization and classification.

One of the simplest ranking functions is computed by summing the tf–idf for each query term; many more sophisticated ranking functions are variants of this simple model.


b. Consider a very small collection that consists the following three documents with the
given contents:

d1 : "Computer Science Engineering"
d2: "lnformation Science Engineering "
d3: "Computer science applications"

Rank the documents for the query "computer engineering" using vector model. Assume tf-idf ranking scheme and length normalization.

https://www.site.uottawa.ca/~diana/csi4107/cosine_tf_idf_example.pdf

c. What is a skip pointer? Explain the algorithm for the intersection of postings lists p1 and p2 using skip pointers.

Skip pointers are effectively shortcuts that allow us to avoid processing parts of the postings list that will not figure in the search results.

2019

2.a Explain how Euclidean distance function and cosine similarity can be used as 
similarity measures. Will a document pair found 'similar' with cosine similarity
measure be similar with distance function similarity measure? Justify your
answer with a suitable example.

b. Write note on Boolean and Vector classical models for information retrieval. What are the advantages of vector model over Boolean model.

Boolean Retrieval

The (standard) Boolean model of information retrieval (BIR)[1] is a classical information retrieval (IR) model and, at the same time, the first and most-adopted one. It is used by many IR systems to this day.[citation needed] The BIR is based on Boolean logic and classical set theory in that both the documents to be searched and the user's query are conceived as sets of terms (a bag-of-words model). Retrieval is based on whether or not the documents contain the query terms.

Advantages:

• Users are under control of the search results

• The system is nearly transparent to the user

  • Clean formalism
  • Easy to implement
  • Intuitive concept
  • If the resulting document set is either too small or too big, it is directly clear which operators will produce respectively a bigger or smaller set.
  • It gives (expert) users a sense of control over the system. It is immediately clear why a document has been retrieved given a query.

Disadvantages:

• Only give inclusion or exclusion of docs, not rankings

• Users would need to spend more effort in manually examining the returned

sets; sometimes it is very labor intensive

• No fuzziness allowed so the user must be very precise and good at writing

their queries

• However, in many cases users start a search because they don’t know the answer

(document)

  • Exact matching may retrieve too few or too many documents
  • Hard to translate a query into a Boolean expression
  • All terms are equally weighted
  • More like data retrieval than information retrieval
  • Retrieval based on binary decision criteria with no notion of partial matching
  • No ranking of the documents is provided (absence of a grading scale)
  • Information need has to be translated into a Boolean expression, which most users find awkward
  • The Boolean queries formulated by the users are most often too simplistic
  • The model frequently returns either too few or too many documents in response to a user query

Vector space model or term vector model is an algebraic model for representing text documents (and any objects, in general) as vectors of identifiers (such as index terms).

Definitions[edit]

Documents and queries are represented as vectors.

Each dimension corresponds to a separate term. If a term occurs in the document, its value in the vector is non-zero. Several different ways of computing these values, also known as (term) weights, have been developed. One of the best known schemes is tf-idf weighting (see the example below).

The definition of term depends on the application. Typically terms are single words, keywords, or longer phrases. If words are chosen to be the terms, the dimensionality of the vector is the number of words in the vocabulary (the number of distinct words occurring in the corpus).

Vector operations can be used to compare documents with queries.

Applications[edit]

Vector space model.jpg

Relevance rankings of documents in a keyword search can be calculated, using the assumptions of document similarities theory, by comparing the deviation of angles between each document vector and the original query vector where the query is represented as a vector with same dimension as the vectors that represent the other documents.

In practice, it is easier to calculate the cosine of the angle between the vectors, instead of the angle itself:

Where  is the intersection (i.e. the dot product) of the document (d2 in the figure to the right) and the query (q in the figure) vectors,  is the norm of vector d2, and  is the norm of vector q. The norm of a vector is calculated as such:

Using the cosine the similarity between document dj and query q can be calculated as:

As all vectors under consideration by this model are element wise nonnegative, a cosine value of zero means that the query and document vector are orthogonal and have no match (i.e. the query term does not exist in the document being considered). See cosine similarity for further information.

Advantages

  1. Simple model based on linear algebra
  2. Term weights not binary
  3. Allows computing a continuous degree of similarity between queries and documents
  4. Allows ranking documents according to their possible relevance
  5. Allows partial matching

DIsadvanatges

  1. Long documents are poorly represented because they have poor similarity values (a small scalar product and a large dimensionality)
  2. Search keywords must precisely match document terms; word substrings might result in a "false positive match"
  3. Semantic sensitivity; documents with similar context but different term vocabulary won't be associated, resulting in a "false negative match".
  4. The order in which the terms appear in the document is lost in the vector space representation.
  5. Theoretically assumes terms are statistically independent.
  6. Weighting is intuitive but not very formal.

c. Explain the classic probabilistic model. What are the advantages and disadvantages of this model?


  • Classic probabilistic model introduced in 1976 by Robersto and Sparck Jones
  • Later became known as the binary independence retrieval (BIR) model.
  • Attempts to capture the IR problem within a probabilistic framework.
  • Probabilistic Model Computes the probability that the document is relevant to the query -ranks the documents according to their probability of being relevant to the query  
  • Assumption: there is a set R of relevant documents which maximizes the overall probability of relevance (R: ideal answer set)
  • R is not known in advance initially assume a description (the terms) of R iteratively refine this description
  • Given a user query, there is a set of documents that contains exactly the relevant documents.
    • This set of documents is referred to as the ideal answer set.
    • Thus, we can think of the querying process as a process of
    specifying the properties of an ideal answer set.
    • The problem is that we do not know exactly what these
    properties are. 

Monk and Inversions

using System; public class Solution { public static void Main () { int T = Convert . ToInt32 ( Console . ReadLine...