- MapReduce is a software framework and programming model that allows us to perform distributed and parallel processing on large data sets in a distributed environment
- It is the processing unit in Hadoop.
- MapReduce consists of two distinct tasks – Map and Reduce
- It works by dividing the task into independent subtasks and executes them in parallel across various DataNodes thereby increasing the throughput,fially
- Map tasks deal with splitting and mapping of data while Reduce tasks shuffle and reduce the data.
- Hadoop is capable of running MapReduce programs written in various languages: Java, Ruby, Python, and C++.
- The input to each phase is key-value pairs. The
type of key, value pairs is specified by the programmer through the InputFormat class. By default, the text input format is used.
- The first is the map job, where a block of data is read and processed to produce key-value pairs as intermediate outputs.
- The output of a Mapper or map job (key-value pairs) is input to the Reducer.
- The reducer receives the key-value pair from multiple map jobs.
- Then,
the reducer aggregates those intermediate data tuples (intermediate
key-value pair) into a smaller set of tuples or key-value pairs which is
the final output.
MapReduce Architecture
Basic strategy: divide & conquer
Partition a large problem into smaller subproblems, to the extent that subproblems are independent.
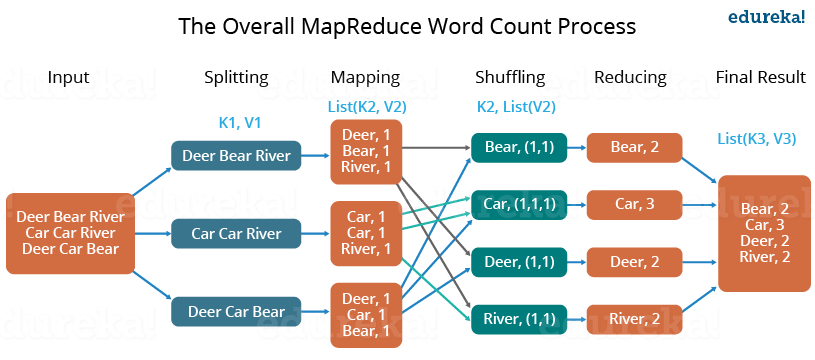
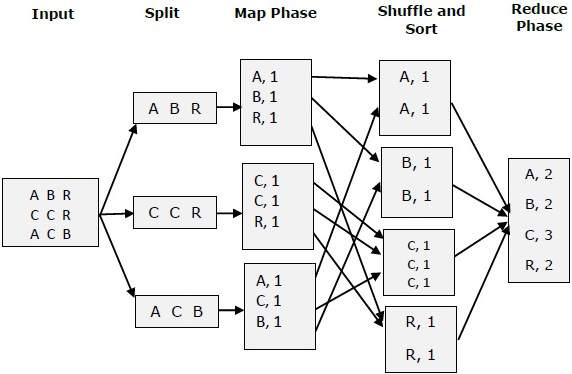
The whole process goes through four phases of execution namely, splitting, mapping, shuffling, and reducing.
The data goes through the following phases of MapReduce in Big Data
Spliting
An input to a MapReduce in Big Data job is divided into fixed-size pieces called input splits Input split is a chunk of the input that is consumed by a single map
Mapping
- This is the very first phase in the execution of map-reduce program.
- In this phase data in each split is passed to a mapping function to produce output values.
Shuffling
- This phase consumes the output of Mapping phase.
- Its task is to consolidate the relevant records from Mapping phase output.
- In our example, the same words are clubbed together along with their respective frequency.
Reducing
- In this phase, output values from the Shuffling phase are aggregated.
- This phase combines values from Shuffling phase and returns a single output value.
- In short, this phase summarizes the complete dataset.
How MapReduce Organizes Work?
Hadoop divides the job into tasks. There are two types of tasks:
- Map tasks (Splits & Mapping)
- Reduce tasks (Shuffling, Reducing)
The complete execution process (execution of Map and Reduce tasks, both) is controlled by two types of entities called a
- Jobtracker: Acts like a master (responsible for complete execution of submitted job)
- Multiple Task Trackers: Acts like slaves, each of them performing the job
For every job submitted for execution in the system, there is one Jobtracker that resides on Namenode and there are multiple tasktrackers which reside on Datanode.

- A job is divided into multiple tasks which are then run onto multiple data nodes in a cluster.
- It is the responsibility of job tracker to coordinate the activity by scheduling tasks to run on different data nodes.
- Execution of individual task is then to look after by task tracker, which resides on every data node executing part of the job.
- Task tracker's responsibility is to send the progress report to the job tracker.
- In addition, task tracker periodically sends 'heartbeat' signal to the Jobtracker so as to notify him of the current state of the system.
- Thus job tracker keeps track of the overall progress of each job. In the event of task failure, the job tracker can reschedule it on a different task tracker.
Advantages of MapReduce
The two biggest advantages of MapReduce are:
1. Parallel Processing:
In MapReduce, we are dividing the job among multiple nodes and each node works with a part of the job simultaneously. So, MapReduce is based on Divide and Conquer paradigm which helps us to process the data using different machines. As the data is processed by multiple machines instead of a single machine in parallel, the time taken to process the data gets reduced by a tremendous amount
2. Data Locality:
Instead of moving data to the processing unit, we are moving the processing unit to the data in the MapReduce Framework. In the traditional system, we used to bring data to the processing unit and process it. But, as the data grew and became very huge, bringing this huge amount of data to the processing unit posed the following issues:
- Moving huge data to processing is costly and deteriorates the network performance.
- Processing takes time as the data is processed by a single unit which becomes the bottleneck.
- The master node can get over-burdened and may fail.
Now, MapReduce allows us to overcome the above issues by bringing the processing unit to the data. So, as you can see in the above image that the data is distributed among multiple nodes where each node processes the part of the data residing on it. This allows us to have the following advantages:
- It is very cost-effective to move processing unit to the data.
- The processing time is reduced as all the nodes are working with their part of the data in parallel.
- Every node gets a part of the data to process and therefore, there is no chance of a node getting overburdened.
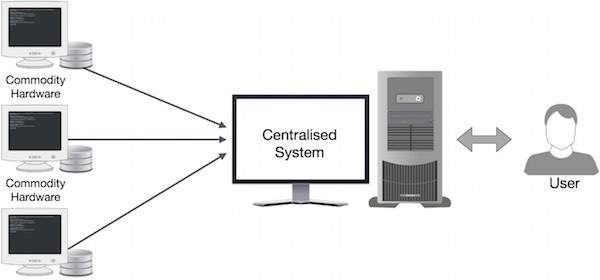
Traditional Enterprise Systems normally have a centralized server to store and process data. The following illustration depicts a schematic view of a traditional enterprise system. Traditional model is certainly not suitable to process huge volumes of scalable data and cannot be accommodated by standard database servers. Moreover, the centralized system creates too much of a bottleneck while processing multiple files simultaneously.

Google solved this bottleneck issue using an algorithm called MapReduce. MapReduce divides a task into small parts and assigns them to many computers. Later, the results are collected at one place and integrated to form the result dataset.
MapReduce-Example
Let us take a real-world example to comprehend the power of MapReduce. Twitter receives around 500 million tweets per day, which is nearly 3000 tweets per second. The following illustration shows how Tweeter manages its tweets with the help of MapReduce.
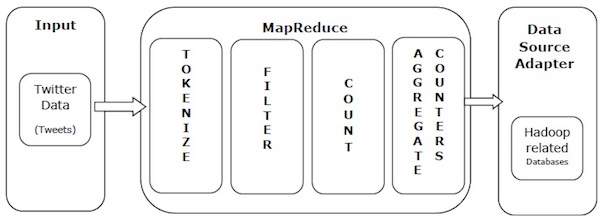
As shown in the illustration, the MapReduce algorithm performs the following actions −
Tokenize − Tokenizes the tweets into maps of tokens and writes them as key-value pairs.
Filter − Filters unwanted words from the maps of tokens and writes the filtered maps as key-value pairs.
Count − Generates a token counter per word.
Aggregate Counters − Prepares an aggregate of similar counter values into small manageable units.
MapReduce - Algorithm
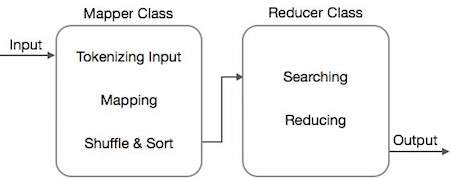
The MapReduce algorithm contains two important tasks, namely Map and Reduce.
- The map task is done by means of Mapper Class
- The reduce task is done by means of Reducer Class.
Mapper class takes the input, tokenizes it, maps and sorts it. The output of Mapper class is used as input by Reducer class, which in turn searches matching pairs and reduces them.
MapReduce implements various mathematical algorithms to divide a task into small parts and assign them to multiple systems. In technical terms, MapReduce algorithm helps in sending the Map & Reduce tasks to appropriate servers in a cluster.
These mathematical algorithms may include the following −
- Sorting
- Searching
- Indexing
- TF-IDF
Sorting
Sorting is one of the basic MapReduce algorithms to process and analyze data. MapReduce implements sorting algorithm to automatically sort the output key-value pairs from the mapper by their keys.
Sorting methods are implemented in the mapper class itself.
In the Shuffle and Sort phase, after tokenizing the values in the mapper class, the Context class (user-defined class) collects the matching valued keys as a collection.
To collect similar key-value pairs (intermediate keys), the Mapper class takes the help of RawComparator class to sort the key-value pairs.
The set of intermediate key-value pairs for a given Reducer is automatically sorted by Hadoop to form key-values (K2, {V2, V2, …}) before they are presented to the Reducer.
Searching
Searching plays an important role in MapReduce algorithm. It helps in the combiner phase (optional) and in the Reducer phase. Let us try to understand how Searching works with the help of an example.
Example
The following example shows how MapReduce employs Searching algorithm to find out the details of the employee who draws the highest salary in a given employee dataset.
Let us assume we have employee data in four different files − A, B, C, and D. Let us also assume there are duplicate employee records in all four files because of importing the employee data from all database tables repeatedly. See the following illustration.

The Map phase processes each input file and provides the employee data in key-value pairs (<k, v> : <emp name, salary>). See the following illustration.

The combiner phase (searching technique) will accept the input from the Map phase as a key-value pair with employee name and salary. Using searching technique, the combiner will check all the employee salary to find the highest salaried employee in each file. See the following snippet.
<k: employee name, v: salary>
Max= the salary of an first employee. Treated as max salary

if(v(second employee).salary > Max){
   Max = v(salary);
}

else{
   Continue checking;
}
The expected result is as follows −
|
Reducer phase − Form each file, you will find the highest salaried employee. To avoid redundancy, check all the <k, v> pairs and eliminate duplicate entries, if any. The same algorithm is used in between the four <k, v> pairs, which are coming from four input files. The final output should be as follows −
<gopal, 50000>
Indexing
Normally indexing is used to point to a particular data and its address. It performs batch indexing on the input files for a particular Mapper.
The indexing technique that is normally used in MapReduce is known as inverted index. Search engines like Google and Bing use inverted indexing technique. Let us try to understand how Indexing works with the help of a simple example.
Example
The following text is the input for inverted indexing. Here T[0], T[1], and t[2] are the file names and their content are in double quotes.
T[0] = "it is what it is"
T[1] = "what is it"
T[2] = "it is a banana"
After applying the Indexing algorithm, we get the following output −
"a": {2}
"banana": {2}
"is": {0, 1, 2}
"it": {0, 1, 2}
"what": {0, 1}
Here "a": {2} implies the term "a" appears in the T[2] file. Similarly, "is": {0, 1, 2} implies the term "is" appears in the files T[0], T[1], and T[2].
TF-IDF
TF-IDF is a text processing algorithm which is short for Term Frequency − Inverse Document Frequency. It is one of the common web analysis algorithms. Here, the term 'frequency' refers to the number of times a term appears in a document.
Term Frequency (TF)
It measures how frequently a particular term occurs in a document. It is calculated by the number of times a word appears in a document divided by the total number of words in that document.
TF(the) = (Number of times term the ‘the’ appears in a document) / (Total number of terms in the document)
Inverse Document Frequency (IDF)
It measures the importance of a term. It is calculated by the number of documents in the text database divided by the number of documents where a specific term appears.
While computing TF, all the terms are considered equally important. That means, TF counts the term frequency for normal words like “is”, “a”, “what”, etc. Thus we need to know the frequent terms while scaling up the rare ones, by computing the following −
IDF(the) = log_e(Total number of documents / Number of documents with term ‘the’ in it).
The algorithm is explained below with the help of a small example.
Example
Consider a document containing 1000 words, wherein the word hive appears 50 times. The TF for hive is then (50 / 1000) = 0.05.
Now, assume we have 10 million documents and the word hive appears in 1000 of these. Then, the IDF is calculated as log(10,000,000 / 1,000) = 4.
The TF-IDF weight is the product of these quantities − 0.05 × 4 = 0.20.
