Showing posts with label Data Mining. Show all posts

Wednesday, December 16, 2020

Categorization of clustering methods

  In general, the major clustering methods can be classified into the following categories.

Partitioning Methods

 Hierarchical Methods

 Density-Based Methods

 Grid-Based Methods


Partitioning approach:

  • in partitioning approach, we construct various partitions and then evaluate them by some criterion.
  • Given a database of n objects, a partitioning method constructs k partitions of the data object, where each partition represents a cluster. i.e., it clusters the data into k groups, which together satisfy the following requirements:

(1) each group must contain at least one object, and

(2) each object must belong to exactly one group

Typical methods: k-means, k-medoids, 

Hierarchical approach:

  • A hierarchical clustering method works by grouping data objects into a tree of clusters.
  • New clusters are formed using a previously formed one.
  • Hierarchical clustering methods can be further classified into,

Agglomerative hierarchical clustering (Bottom- Up) - This bottom-up strategy starts by placing each object in its own cluster and then merges these atomic clusters into larger and larger clusters until all of the objects are in a single cluster or until certain termination conditions are satisfied. Most hierarchical clustering methods belong to this category.

Divisive hierarchical clustering (Top- Down) - This top-down strategy does the reverse of agglomerative hierarchical clustering by starting with all objects in one cluster. It subdivides the cluster into smaller and smaller pieces until each object forms a cluster on its own or until it satisfies certain termination conditions.

Typical methods: Diana, BIRCH, CAMELEON, CURE

Density-based approach:

  • Most partitioning methods cluster the objects based on the distance between objects. 
  • Such methods can find only spherical-shaped clusters and encounter difficulty in discovering clusters of arbitrary shapes.
  • Density-based clustering methods have been developed based on connectivity and density functions.

Typical methods: DBSACN, OPTICS, DenClue

Grid-based approach:

  • Grid-based methods quantize the object space into a finite number of cells that form a grid structure. 
  • All of the clustering operations are performed on the grid structure (i.e., on the quantized space).
  • The main advantage of this approach is its fast processing time, which is typically independent of the number of data objects and dependent only on the number of cells in each dimension in the quantized space.

 Typical methods: STING, WaveCluster, CLIQUE

Model-based:

  • Model-based methods hypothesize a model for each of the clusters and find the best fit of the data to the given model.
Typical methods: Expectation-Maximization (EM), SOM, COBWEB

Frequent pattern-based:

  • Based on the analysis of frequent patterns.

Typical methods: p-Cluster

User-guided or constraint-based:

  • Clustering by considering user-specified or application-specific constraints

Typical methods: COD (obstacles), constrained clustering

Hierarchical Clustering method- BIRCH


 Hierarchical Clustering method

A hierarchical clustering method works by grouping data objects into a tree of clusters. Hierarchical clustering methods can be further classified into,
  • Agglomerative hierarchical clustering (Bottom- Up) - This bottom-up strategy starts by placing each object in its own cluster and then merges these atomic clusters into larger and larger clusters until all of the objects are in a single cluster or until certain termination conditions are satisfied. Most hierarchical clustering methods belong to this category.
  • Divisive hierarchical clustering (Top- Down) - This top-down strategy does the reverse of agglomerative hierarchical clustering by starting with all objects in one cluster. It subdivides the cluster into smaller and smaller pieces until each object forms a cluster on its own or until it satisfies certain termination conditions.

BIRCH

  • BIRCH stands for Balanced Iterative Reducing and Clustering Using Hierarchies, which uses hierarchical methods to cluster and reduce data.
  • BIRCH only needs to scan the data set in a single pass to perform clustering.
  • Given ―n d-dimensional data objects or points in a cluster, we can define the centroid x0, radius R, and diameter D of the cluster.
  • The BIRCH algorithm uses a tree structure to create a cluster. It is generally called the Clustering Feature Tree (CF Tree). Each node of this tree is composed of several Clustering features (CF).
  • Clustering Feature tree structure is similar to the balanced B+ tree.
  • Each node including leaf nodes has several CFs, and the CFs of internal nodes have pointers to child nodes, and all leaf nodes are linked by a doubly linked list.
  • Each CF is a triplet, which can be represented by (N, LS, SS).
Where, N represents the number of sample points in the CF, which is easy to understand,
LS represents the vector sum of the feature dimensions of the sample points in the CF, 
SS represents the square of the feature dimensions of the sample points in the CF.
  • For example, as shown in the following figure, in a CF of a node in the CF Tree, there are the following 5 samples (3,4), (2,6), (4,5), (4,7), ( 3,8). Then it corresponds to,
Image for post
Algorithm

Phase 1: Build the CF Tree. Load the data into memory by building a cluster-feature tree (CF tree, defined below). Optionally, condense this initial CF tree into a smaller CF.
Phase 2: Global Clustering. Apply an existing clustering algorithm on the leaves of the CF tree. Optionally, refine these clusters.

Advantages
  • Save memory, all samples are on disk, CF Tree only stores CF nodes and corresponding pointers.
  • The clustering speed is fast, and it only takes one scan of the training set to build the CF Tree, and the addition, deletion, and modification of the CF Tree are very fast.
  • Noise points can be identified, and preliminary classification pre-processing can be performed on the data set.
Disadvantages
  • Since CF Tree has a limit on the number of CFs per node, the clustering result may be different from the real category distribution.
  • The data clustering effect is not good on high-dimensional features. 
  • If the distribution cluster of the data set is not similar to a hyper-sphere or is not convex, the clustering effect is not good.


Important Questions on Data Mining


1.  How is data mining related to business intelligence?
  • Businesses use data mining for business intelligence and to identify specific data that may help their companies make better leadership and management decisions. 
  • Data mining experts sift through large data sets to identify trends and patterns.
  • Various software packages and analytical tools can be used for data mining. 
  • The process can be automated or done manually. 
  • Data mining allows individual workers to send specific queries for information to archives and databases so that they can obtain targeted results.
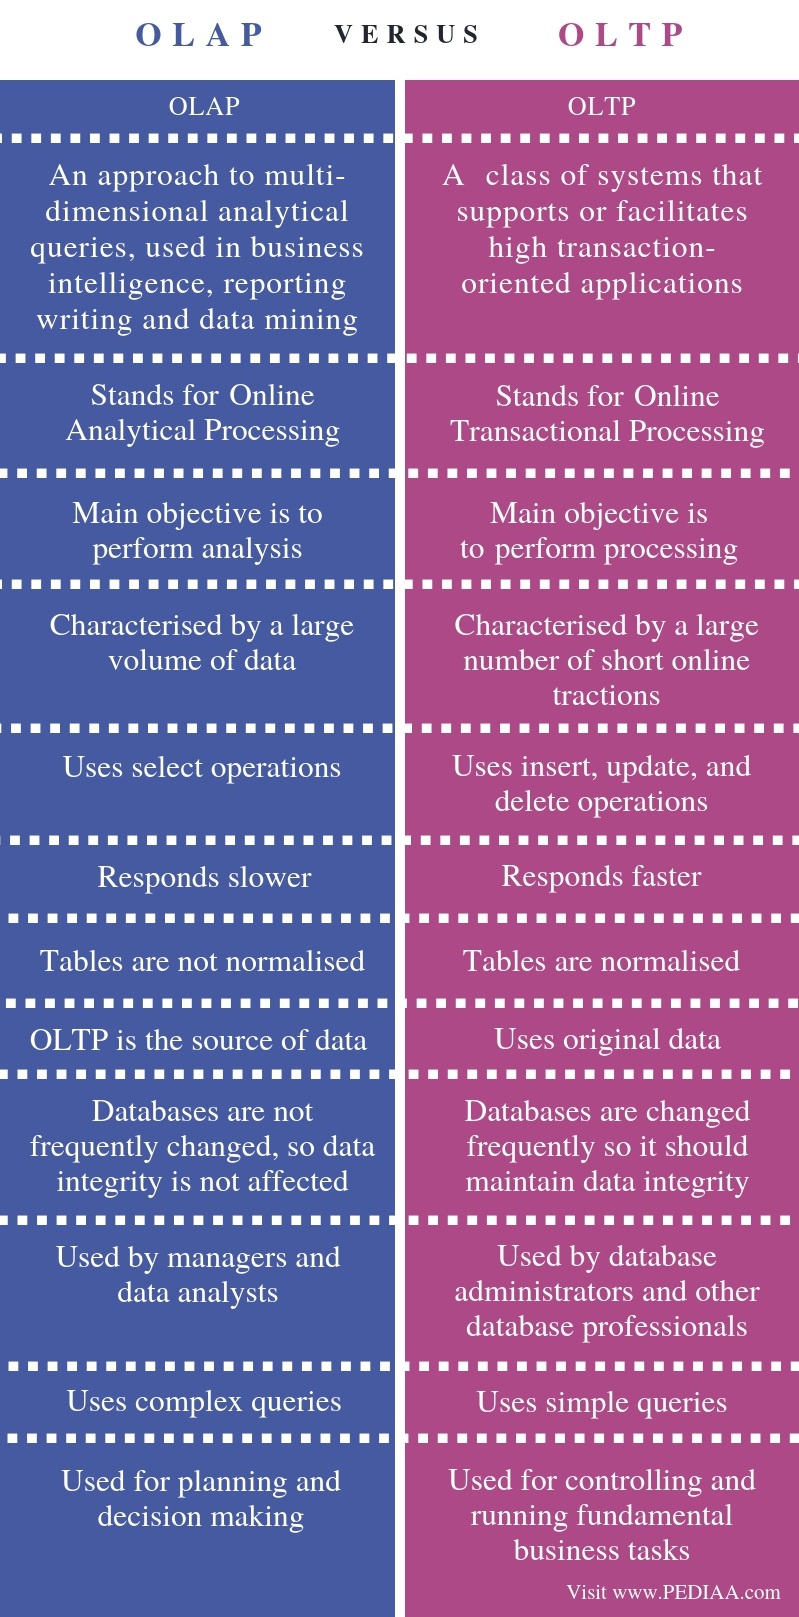
2. Differentiate between OLTP and OLAP.

What is the Difference Between OLAP and OLTP - Pediaa.Com

3. Why do we need data transformation? What are the different ways of data transformation?

The process of transforming the data into appropriate forms suitable for the mining process is known as data transformation. We need data transformation for changing the format, structure, or values of data.
The different ways of data transformation are,

Smoothing - It is a process that is used to remove noise from the data set using some algorithms
Aggregation - Data collection or aggregation is the method of storing and presenting data in a summary format.
Normalization - It is done to scale the data values in a specified range like 0.0 to 1.0.
Attribute Selection - In this strategy, new attributes are constructed from the given set of attributes to help the mining process.
Generalization - Here, low-level data are replaced with high-level data by using concept hierarchies climbing. For Example-The attribute “city” can be converted to “country”.
Discretization - This is done to replace the raw values of a numeric attribute by ranges or conceptual levels.

4. An airport security screening station wants to determine if passengers are criminals or not. To do this, the faces of passengers are scanned and kept in a database. Is this a classification or prediction task? Justify  

This is a classification task. Classification is the forms of data analysis. It helps to organise and categorise data in distinct classes.
The Data Classification process includes two steps −

Building the Classifier or Model

  • This step is the learning step or the learning phase.
  • In this step, the classification algorithms build the classifier.
  • The classifier is built from the training set made up of database tuples and their associated class labels.
  • Each tuple that constitutes the training set is referred to as a category or class. These tuples can also be referred to as sample, object, or data points.
Using Classifier for Classification
  • In this step, the classifier is used for classification. 
  • Here the test data is used to estimate the accuracy of classification rules. 
  • The classification rules can be applied to the new data tuples if the accuracy is considered acceptable.
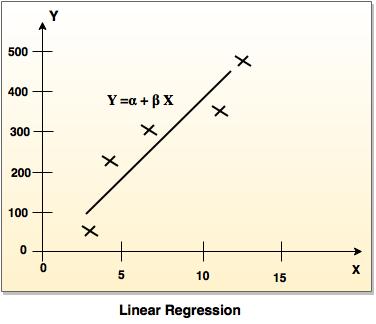
5. Where do we use Linear regression? Explain linear regression.


  • Linear regression is the simplest form of regression which attempts to model the relationship between two variables by fitting a linear equation to observe the data.
  • Linear regression attempts to find the mathematical relationship between variables.
  • If the outcome is a straight line then it is considered as a linear model and if it is a curved line, then it is a non-linear model.
  • The relationship between the dependent variable is given by straight line and it has only one independent variable.
Y =  α + Β X
Model 'Y', is a linear function of 'X'.
  • The value of 'Y' increases or decreases in a linear manner according to which the value of 'X' also changes.
linear regression

6. What is the significance of tree pruning in decision tree algorithms? 

  • Tree pruning is performed to remove anomalies in the training data due to noise or outliers. 
  • The pruned trees are smaller and less complex.
Tree Pruning Approaches

There are two approaches to prune a tree −
Pre-pruning − The tree is pruned by halting its construction early.
Post-pruning - This approach removes a sub-tree from a fully grown tree.

7. What are the two measures used for rule interestingness?

Some of the interestingness measures are,
φ-coefficient: The phi-square is a measure of the correlation between two categorical
variables in a 2 x 2 table. Its value can range from 0 (no relation between factors) to 1
(perfect relation between the two factors).

Odds ratio (α): This measure represents the odds for obtaining the different outcomes of a variable. We can use the ratio of these odds to determine the degree to which two terms are associated with each other.

8. Given two objects represented by the tuples (22,1,42,10) and (20,0,36,8)
Compute the Manhattan distance between the two objects.

d=|22-20|+|1-0|+|42-36|+|10-8|
 =2+1+6+2 =11

9. How density-based clustering varies from other methods?

  • Most partitioning methods cluster the objects, based on the distance between objects. Such methods can find only spherical-shaped clusters and encounter difficulty in discovering clusters of arbitrary shapes. 
  • Density-based clustering methods have been developed based on the notion of density. 
  • Based on connectivity and density functions 
  • Typical methods: DBSACN, OPTICS, DenClue 
10. Differentiate web content mining and web structure mining.

Web content mining: 
  • Web content mining is the application of extracting useful information from the content of the web documents. 
  • Web content consists of several types of data – text, image, audio, video etc. It can provide effective and interesting patterns about user needs. 
  • Text documents are related to text mining, machine learning and natural language processing. This mining is also known as text mining. 
Web structure mining:
  • Web structure mining is the application of discovering structure information from the web. 
  • The structure of the web graph consists of web pages as nodes and hyperlinks as edges connecting related pages. 
  • Structure mining basically shows the structured summary of a particular website. 
  • It identifies the relationship between web pages linked by information or direct link connection.

 11. How is data warehouse different from a database? How are they similar?

Differences

  • Database is a collection of related data that represents some elements of the real world whereas Data warehouse is an information system that stores historical and commutative data from single or multiple sources.
  • Database is designed to record data whereas the Data warehouse is designed to analyze data.
  • Database is application-oriented-collection of data whereas Data Warehouse is the subject-oriented collection of data.
  • Database uses Online Transactional Processing (OLTP) whereas Data warehouse uses Online Analytical Processing (OLAP).
Similarities 
  • The similarity between data warehouse and database is that both the systems maintain data in the form of table, indexes, columns, views, and keys. 
  • Also, data is retrieved in both by using SQL queries.

12. Compare star and snowflake schema dimension table.

Difference Between Star and Snowflake Schema | Difference Between

13. Explain the attribute selection method in decision trees.

If the dataset consists of N attributes then deciding which attribute to place at the root or at different levels of the tree as internal nodes is a complicated step. So we use some criteria like :

  • Entropy,
  • Information gain,
  • Gain Ratio,


  • 14. Distinguish between hold out method and cross-validation method.

    Hold-out is when you split up your dataset into a ‘train’ and ‘test’ set. The training set is what the model is trained on, and the test set is used to see how well that model performs on unseen data. The hold-out method is good to use when you have a very large dataset,

    Cross-validation or ‘k-fold cross-validation’ is when the dataset is randomly split up into ‘k’ groups. One of the groups is used as the test set and the rest are used as the training set. The model is trained on the training set and scored on the test set. Then the process is repeated until each unique group as been used as the test set.

    15. Explain prepruning and postpruning approaches in decision tree algorithm.

    Pre-pruning that stop growing the tree earlier, before it perfectly classifies the training set.
    Post-pruning that allows the tree to perfectly classify the training set, and then post prune the tree. 

    16. Differentiate between support and confidence.

    Support is an indication of how frequently the itemset appears in the dataset.
    Confidence is an indication of how often the rule has been found to be true.

    17. How to compute the dissimilarity between objects described by binary variables

    • A binary variable has only two states: 0 or 1, where 0 means that the variable is absent, and 1 means that it is present. 
    • Treating binary variables as if they are interval-scaled can lead to misleading clustering results. 
    • Therefore, methods specific to binary data are necessary for computing dissimilarities. 
    • One approach involves computing a dissimilarity matrix from the given binary data. 
    • If all binary variables are thought of as having the same weight, we have the 2-by-2 contingency table


    Tuesday, December 15, 2020

    Classification and Prediction in Data Mining


    • Classification and prediction are two forms of data analysis that can be used to extract models describing important data classes or to predict future data trends. 
    • Classification predicts categorical (discrete, unordered)  class labels &  Prediction, models continuous-valued functions.
    • The goal of prediction is to forecast or deduce the value of an attribute based on values of other attributes.
    • The goal of data classification is to organize and categorize data in distinct classes.

    The Data Classification process includes two steps −

    • Building the Classifier or Model
    • Using Classifier for Classification

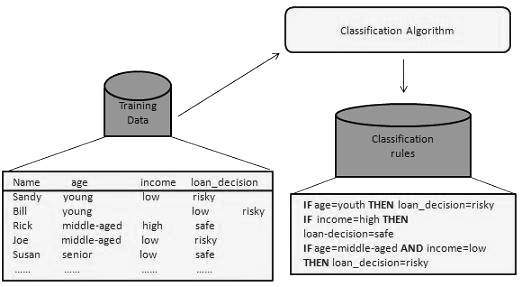
    Building the Classifier or Model


    • This step is the learning step or the learning phase.
    • In this step, the classification algorithms build the classifier.
    • The classifier is built from the training set made up of database tuples and their associated class labels.
    • Each tuple that constitutes the training set is referred to as a category or class. These tuples can also be referred to as sample, object, or data points.

    Building the Classifier or Model


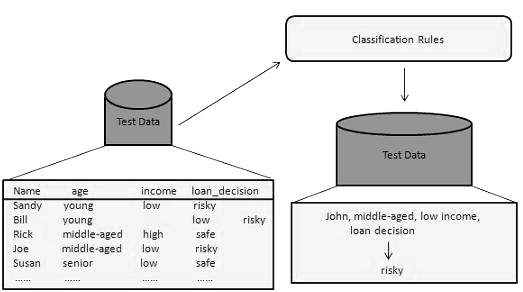
    Using Classifier for Classification

    • In this step, the classifier is used for classification. 
    • Here the test data is used to estimate the accuracy of classification rules. 
    • The classification rules can be applied to the new data tuples if the accuracy is considered acceptable.
    Using the Classifier


    Classification and Prediction Issues


    The major issue is preparing the data for Classification and Prediction. Preparing the data involves the following activities −

    • Data Cleaning − Data cleaning involves removing the noise and treatment of missing values. The noise is removed by applying smoothing techniques and the problem of missing values is solved by replacing a missing value with the most commonly occurring value for that attribute.
    • Relevance Analysis − Database may also have irrelevant attributes. Correlation analysis is used to know whether any two given attributes are related.
    • Data Transformation and reduction − The data can be transformed by any of the following methods.
      • Normalization − The data is transformed using normalization. Normalization involves scaling all values for a given attribute in order to make them fall within a small specified range. Normalization is used when in the learning step, the neural networks or the methods involving measurements are used.
      • Generalization − The data can also be transformed by generalizing it to the higher concept. For this purpose, we can use the concept hierarchies.

    Note − Data can also be reduced by some other methods such as wavelet transformation, binning, histogram analysis, and clustering.

    Data Preprocessing in Data Mining


    Data preprocessing is a data mining technique that is used to transform the raw data into a useful and efficient format. 
    Steps involved  are,
    • Data Cleaning
    • Data Integration
    • Data Transformation
    • Data Reduction
    • Data Discretization and Concept Hierarchy Generation

     Data Cleaning

    Data cleaning in data mining is the process of detecting and removing incomplete, noisy, and inconsistent data.

    # We can remove the incomplete data by following methods,
    • Ignore the tuples - This approach is suitable only when the dataset we have is quite large and multiple values are missing within a tuple.
    • Fill the Missing values - We can fill the missing values manually, by attribute mean or the most probable value.
    # Noisy Data (meaningless data) can be handled by,
    • Binning Method - This method works on sorted data to smooth it. The whole data is divided into segments of equal size and then various methods are performed to complete the task.
    For Example,

    There are three approaches to perform smoothing –

    # Smoothing by bin means: In smoothing by bin means, each value in a bin is replaced by the mean value of the bin.
    # Smoothing by bin median: In this method, each bin value is replaced by its bin median value.
    # Smoothing by bin boundary: In smoothing by bin boundaries, the minimum and maximum values in a given bin are identified as the bin boundaries. Each bin value is then replaced by the closest boundary value.

    Approach:
    1. Sort the array of the given data set.
    2. Divides the range into N intervals, each containing the approximately same number of samples(Equal-depth partitioning).
    3. Store mean/ median/ boundaries in each row.

    Example

    Sorted data: 4, 8, 9, 15, 21, 21, 24, 25, 26, 28, 29, 34

    Smoothing by bin means:
          - Bin 1: 9, 9, 9, 9
          - Bin 2: 23, 23, 23, 23
          - Bin 3: 29, 29, 29, 29

    Smoothing by bin boundaries:
          - Bin 1: 4, 4, 4, 15
          - Bin 2: 21, 21, 25, 25
          - Bin 3: 26, 26, 26, 34

    Smoothing by bin median:
          - Bin 1: 9 9, 9, 9
          - Bin 2: 24, 24, 24, 24
          - Bin 3: 29, 29, 29, 29


    • Regression - Data can be smoothed by fitting the data into a regression function.
    • Clustering - This approach groups similar data into a cluster. Values that fall outside of the set of clusters may be considered outliers.

    Data Integration

    Data Integration is a data preprocessing technique that combines data from multiple sources and provides users with a unified view of these data.

    The data integration approaches are formally defined as triple <G, S, M> where,

    G stand for the global schema,
    S stands for a heterogeneous source of schema,
    M stands for mapping between the queries of source and global schema.

    There are mainly 2 major approaches for data integration – one is “tight coupling approach” and another is the “loose coupling approach”.

    * Tight Coupling - In this coupling, data is combined from different sources into a single physical location through the process of ETL – Extraction, Transformation, and Loading.
    * Loose Coupling - Here, the data only remains in the actual source databases.

    Issues in Data Integration

    • Schema Integration
    • Redundancy
    • Detection and resolution of data value conflicts

    Data Transformation

    The process of transforming the data into appropriate forms suitable for the mining process. This involves the following ways,

    • Normalization - It is done to scale the data values in a specified range like 0.0 to 1.0.
    • Attribute Selection - In this strategy, new attributes are constructed from the given set of attributes to help the mining process.
    • Generalization - Here, low-level data are replaced with high-level data by using concept hierarchies climbing. For Example-The attribute “city” can be converted to “country”.
    • Smoothing - It is a process that is used to remove noise from the data set using some algorithms
    • Aggregation - Data collection or aggregation is the method of storing and presenting data in a summary format.
    • Discretization - This is done to replace the raw values of a numeric attribute by ranges or conceptual levels.

    Data Reduction

    Data reduction techniques can be applied to obtain a reduced representation of the data which aims to increase storage efficiency and reduce data storage and analysis costs. The various steps to data reduction are:

    • Data Cube Aggregation - Aggregation operation is applied to data for the construction of the data cube.
    • Numerosity Reduction - This enables to store the model of data instead of whole data, e.g. Regression Models.
    • Dimensionality Reduction - This reduces the size of data by encoding mechanisms. It can be lossy or lossless. If the original data can be retrieved after reconstruction from compressed data, such reduction is called lossless reduction else it is called lossy reduction. The two effective methods of dimensionality reduction are: Wavelet transforms and PCA (Principal Component Analysis).
    • Attribute Subset Selection - The goal of attribute subset selection is to find a minimum set of attributes such that dropping of those irrelevant attributes.
    Methods of Attribute Subset Selection

    1. Stepwise Forward Selection

    * This procedure starts with an empty set of attributes as the minimal set. 
    * The most relevant attributes are chosen(having minimum p-value) and are added to the minimal set. * In each iteration, one attribute is added to a reduced set.

    2. Stepwise Backward Elimination

    Here all the attributes are considered in the initial set of attributes. In each iteration, one attribute is eliminated from the set of attributes whose p-value is higher than the significance level.

    3. Combination of Forward Selection and Backward Elimination

    * The stepwise forward selection and backward elimination are combined to select the relevant attributes most efficiently. 
    * This is the most common technique which is generally used for attribute selection.

    4. Decision Tree Induction

    * This approach a decision tree is used for attribute selection. 
    * It constructs a flow chart like structure having nodes denoting a test on an attribute. 
    * Each branch corresponds to the outcome of the test and leaf nodes are a class prediction. 
    * The attribute that is not the part of the tree is considered irrelevant and hence discarded.

    Data Discretization and Concept Hierarchy Generation


    Data Discretization techniques can be used to divide the range of continuous attributes into intervals. This leads to a concise, easy-to-use, knowledge-level representation of mining results.
    Discretization techniques can be categorized based on which direction it proceeds, as Top-down & Bottom-up.

    Concept hierarchy method can be used to reduce the data by collecting and replacing low-level concepts with higher-level concepts.

    Typical methods

    * Binning
    * Cluster Analysis
    * Histogram Analysis
    * Entropy-Based Discretization