Wednesday, September 15, 2021

INFORMATION RETRIEVAL 3&4Module

Discuss the concept of hubs and authorities in multimedia indexing.

https://nlp.stanford.edu/IR-book/html/htmledition/hubs-and-authorities-1.html 

https://safecont.com/en/ranking-urls-hubs-authorities/ 

  • given a query, every web page is assigned two scores. One is called its hub score and the other its authority score
  • For any query, we compute two ranked lists of results rather than one. 
  • The ranking of one list is induced by the hub scores and that of the other by the authority scores. 
  • There are two primary kinds of web pages useful as results for broad-topic searche
  •  There are authoritative sources of information on the topic. We will call such pages authorities. They are the pages that will emerge with high authority scores. 
  • There are pages on the Web that are hand-compiled lists of links to authoritative web pages on a specific topic. These hub pages are not in themselves authoritative sources of topic-specific information. 
  •  They are compilations made by someone with an interest in the topic. These hub pages are the pages that will emerge with high hub scores. 
  • A good hub page is one that points to many good authorities; 
  • A good authority page is one that is pointed to by many good hub pages.

Explain how correlated terms are built form local document set through association clustering.

Discuss page rank algorithm in the context of a small web consisting of three pages A,B and C whereby page A links to the pages B and c, page B links to page c and page c links to page A. Assume the damping factor is 0.5. Find the page rankings also.

PR(A) = 0.5 + 0.5 PR(C)
PR(B) = 0.5 + 0.5 (PR(A) / 2)
PR(C) = 0.5 + 0.5 (PR(A) / 2 + PR(B))
We get the following PageRank™  values for the single pages:
PR(A) = 14/13 = 1.07692308
PR(B) = 10/13 = 0.76923077
PR(C) = 15/13 = 1.15384615

The sum of all pages' PageRanks is 3 and thus equals the total number of web pages.

What are the different methods of query expansion?

https://en.wikipedia.org/wiki/Query_expansion 

Explain how the URL frontier maintains the politeness and priority property of crawlers. 

https://nlp.stanford.edu/IR-book/html/htmledition/the-url-frontier-1.html 

Consider a Web graph with three nodes 1,2, and 3. The links are as follows: 'l->2,3->2,2->1, 2->3. Write down the transition probability matrices for the surfer's walk with teleporting, with the value of teleport probability alpha q=0.5. Derive the ranking of the nodes using Page Rank algorithm.
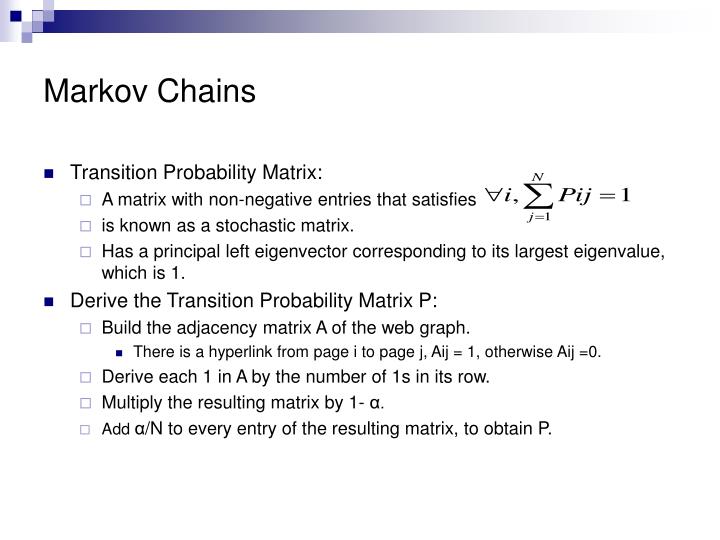
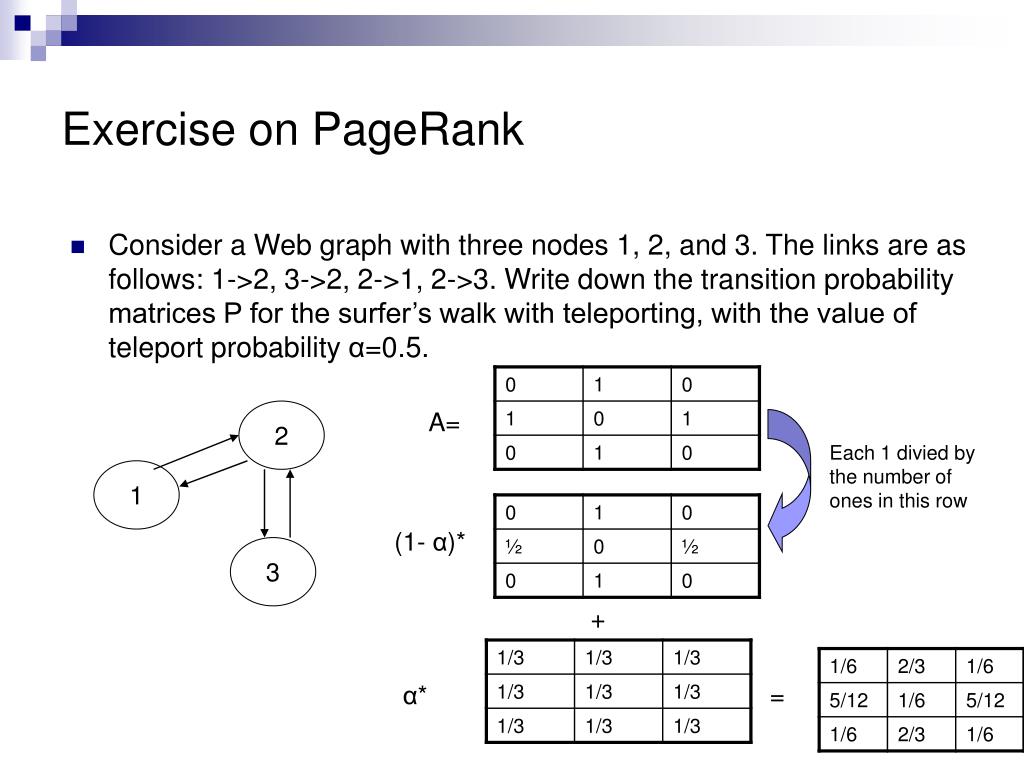
PPT - Introduction to PageRank Algorithm and Programming Assignment 1  PowerPoint Presentation - ID:765052

What is pseudo relevance feedback? What is its disadvantage?


Suppose that a user's initial query is 'cheap CDs cheap DVDs extremely cheap CDs'. The user examines two documents, dl and d2. He judges dl, with the content 'CDs cheap software cheap CDs' relevant and d2 with content 'cheap thrills DVDs'non-relevant. Assume that we are using direct term frequency (with no scaling and no docuhrent frequency). There is no need to length-nonnalize vectors. Using Rocchio
relevance feedback what would the revised query vector be after relevancef eedback?
Assume
α = l, β = 0.75, γ= 0.25.


Discuss Page Ranking.


page rank is a measure of how 'important' a web page is. It works on the basis that when another website links to your web page, it's like a recommendation or vote for that web page. Each link increases the web page's page rank. ... It's a vote from a less-known website that isn't relevant to the subject.

Write note on the User Relevance Feedback strategy for query reformulation. Explain the process of Query Expansion and Term Reweighting for vector model.

Write note on the process of query expansion through Local Clustering. Explain three cluster building strategies for local clustering in detail (association clusters, metric clusters, and scalar clusters).

Module4

Discuss how XML retrieval is performed

Explain how R tree helps in mapping objects into f-D space to do clustering

Explain the application of GEMINI method in colour images. Discuss. its.application in medical field.

Explain any one data structure used in multimedia indexing


Explain the generic multimedia indexing approach for multimedia IR

Briefly explain the vector space model for information retrieval from XML documents


What are spatial access methods?

Explain the generic multimedia indexing approach for multimedia IR
.
Briefly explain the vector space model for information retrieval from XML documents

Aim: to have each dimension of the vector space encode a word together with its position within the XML tree.
How: Map XML documents to lexicalized subtrees.

Take each text node (leaf) and break it into multiple nodes, one for each word. E.g. split Bill Gates into Bill and Gates
Define the dimensions of the vector space to be lexicalized subtrees of documents – subtrees that contain at least one vocabulary term. 


We can now represent queries and documents as vectors in this space of lexicalized subtrees and compute matches between them, e.g. using the vector space formalism.

Write note on two type of multimedia similarity queries Whole Match and Sub-pattern Match queries with example.


Why we need spatial access methods instead of sequential scanning to access multimedia objects? Explain GEMINI algorithm (Explain each step).
 

We need spatial access methods  to organizing spatial data (multidimensional data such as points, line segments, regions, polygons, volumes, or other kinds of geometric entities) that allows the efficient retrieval of data according to a set of search criteria.

What do you mean by curse of dimmsionality? Discuss the difference between feature selection and feature extraction with example. How do these two process contribute to dimensionalitv reduction?


The curse of dimensionality basically means that the error increases with the increase in the number of features. he dimension of a dataset corresponds to the number of attributes/features that exist in a dataset. A dataset with a large number of attributes, generally of the order of a hundred or more, is referred to as high dimensional data.  It refers to the fact that algorithms are harder to design in high dimensions and often have a running time exponential in the dimensions. A higher number of dimensions theoretically allow more information to be stored, but practically it rarely helps due to the higher possibility of noise and redundancy in the real-world data.
Some of the difficulties that come with high dimensional data manifest during analyzing or visualizing the data to identify patterns, and some manifest while training machine learning models. The difficulties related to training machine learning models due to high dimensional data is referred to as ‘Curse of Dimensionality’. The popular aspects of the curse of dimensionality; ‘data sparsity’ and ‘distance concentration’


Feature selection is the process of choosing precise features, from a features pool. This helps in simplification, regularization and shortening training time. This can be done with various techniques: e.g. Linear Regression, Decision Trees.

 Feature extraction is the process of converting the raw data into some other data type, with which the algorithm works is called Feature Extraction. Feature extraction creates a new, smaller set of features that captures most of the useful information in the data.

 The main difference between them is Feature selection keeps a subset of the original features while feature extraction creates new ones.
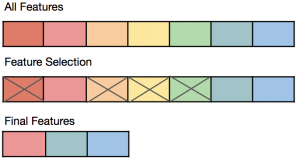
Machine Learning - Feature Selection vs Feature Extraction - Data Analytics

A scalable saliency-based Feature selection method with instance level  information | DeepAI


What is Feature selection

  • Problem of selecting some subset of a learning algorithm’s input variables upon which it should
    focus attention, while ignoring the rest. In other words, Dimensionality Reduction
  • Especially when dealing with a large number of variables there is a need for Dimensionality
    Reduction.
  • Feature Selection can significantly improve a learning algorithm’s performance
  • Many domains have tens of thousands of variables out of which most are irrelevant and redundant.
    Feature selection limits the training data and reduces the amount of computational resources used.
    It can significantly improve a learning algorithms performance.

Feature Extraction

  • Feature extraction is an attribute reduction process. Unlike feature selection, which ranks the
    existing attributes according to their predictive significance, feature extraction actually transforms
    the attributes. The transformed attributes, or features, are linear combinations of the original
    attributes.
  • The general workflow involves applying feature extraction on given data to extract features and
    then apply feature selection with respect to the target variable to select a subset of data. In effect,
    this helps improve the accuracy of a model.
  • For example, in an unsupervised learning problem, the extraction of
    bigrams from a text, or the extraction of contours from an image are examples of feature
    extraction.
  • Feature extraction can be used to extract the themes of a document collection, where documents
    are represented by a set of key words and their frequencies
Monday, August 16, 2021

MapReduce framework

 Hadoop HDFS stores the data, MapReduce processes the data stored in HDFS, and YARN divides the tasks and assigns resources.
  •  MapReduce is a software framework and programming model that allows us to perform distributed and parallel processing on large data sets in a distributed environment
  • It is the processing unit in Hadoop.
  • MapReduce consists of two distinct tasks – Map and Reduce 
  •  It works by dividing the task into independent subtasks and executes them in parallel across various DataNodes thereby increasing the throughput,fially
  • Map tasks deal with splitting and mapping of data while Reduce tasks shuffle and reduce the data. 
  • Hadoop is capable of running MapReduce programs written in various languages: Java, Ruby, Python, and C++. 
  • The input to each phase is key-value pairs.  The type of key, value pairs is specified by the programmer through the InputFormat class. By default, the text input format is used. 
  • The first is the map job, where a block of data is read and processed to produce key-value pairs as intermediate outputs.
  • The output of a Mapper or map job (key-value pairs) is input to the Reducer.
  • The reducer receives the key-value pair from multiple map jobs.
  • Then, the reducer aggregates those intermediate data tuples (intermediate key-value pair) into a smaller set of tuples or key-value pairs which is the final output.

MapReduce Architecture

Basic strategy: divide & conquer
Partition a large problem into smaller subproblems, to the extent that subproblems are independent.

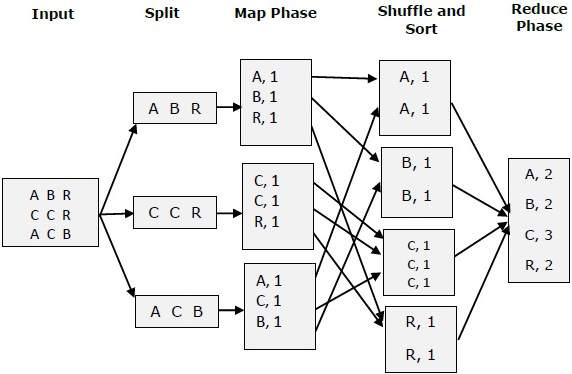
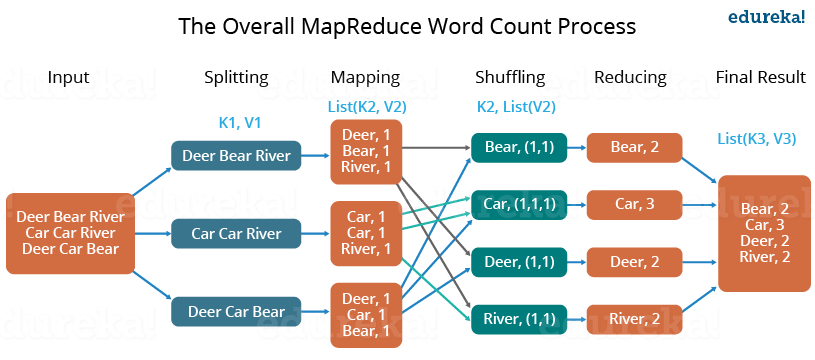
The whole process goes through four phases of execution namely, splitting, mapping, shuffling, and reducing.

MapReduce Way - MapReduce Tutorial - Edureka 


The data goes through the following phases of MapReduce in Big Data

Spliting

An input to a MapReduce in Big Data job is divided into fixed-size pieces called input splits Input split is a chunk of the input that is consumed by a single map

Mapping

  • This is the very first phase in the execution of map-reduce program. 
  • In this phase data in each split is passed to a mapping function to produce output values.

Shuffling

  • This phase consumes the output of Mapping phase. 
  • Its task is to consolidate the relevant records from Mapping phase output. 
  • In our example, the same words are clubbed together along with their respective frequency.

Reducing

  • In this phase, output values from the Shuffling phase are aggregated.
  • This phase combines values from Shuffling phase and returns a single output value. 
  • In short, this phase summarizes the complete dataset.

 MapReduce Work

How MapReduce Organizes Work?

Hadoop divides the job into tasks. There are two types of tasks:

  1. Map tasks (Splits & Mapping)
  2. Reduce tasks (Shuffling, Reducing)

The complete execution process (execution of Map and Reduce tasks, both) is controlled by two types of entities called a

  1. Jobtracker: Acts like a master (responsible for complete execution of submitted job)
  2. Multiple Task Trackers: Acts like slaves, each of them performing the job

For every job submitted for execution in the system, there is one Jobtracker that resides on Namenode and there are multiple tasktrackers which reside on Datanode.

How Hadoop MapReduce Works
 
Working of Hadoop MapReduce
  • A job is divided into multiple tasks which are then run onto multiple data nodes in a cluster.
  • It is the responsibility of job tracker to coordinate the activity by scheduling tasks to run on different data nodes.
  • Execution of individual task is then to look after by task tracker, which resides on every data node executing part of the job.
  • Task tracker's responsibility is to send the progress report to the job tracker.
  • In addition, task tracker periodically sends 'heartbeat' signal to the Jobtracker so as to notify him of the current state of the system. 
  • Thus job tracker keeps track of the overall progress of each job. In the event of task failure, the job tracker can reschedule it on a different task tracker.

Advantages of MapReduce

The two biggest advantages of MapReduce are:

      1. Parallel Processing:

In MapReduce, we are dividing the job among multiple nodes and each node works with a part of the job simultaneously. So, MapReduce is based on Divide and Conquer paradigm which helps us to process the data using different machines. As the data is processed by multiple machines instead of a single machine in parallel, the time taken to process the data gets reduced by a tremendous amount

2. Data Locality: 

Instead of moving data to the processing unit, we are moving the processing unit to the data in the MapReduce Framework.  In the traditional system, we used to bring data to the processing unit and process it. But, as the data grew and became very huge, bringing this huge amount of data to the processing unit posed the following issues: 

  • Moving huge data to processing is costly and deteriorates the network performance. 
  • Processing takes time as the data is processed by a single unit which becomes the bottleneck.
  • The master node can get over-burdened and may fail.  

Now, MapReduce allows us to overcome the above issues by bringing the processing unit to the data. So, as you can see in the above image that the data is distributed among multiple nodes where each node processes the part of the data residing on it. This allows us to have the following advantages:

  • It is very cost-effective to move processing unit to the data.
  • The processing time is reduced as all the nodes are working with their part of the data in parallel.
  • Every node gets a part of the data to process and therefore, there is no chance of a node getting overburdened.
Why MapReduce?

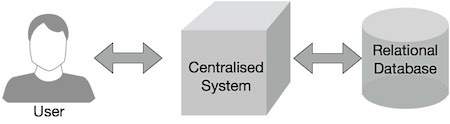
Traditional Enterprise Systems normally have a centralized server to store and process data. The following illustration depicts a schematic view of a traditional enterprise system. Traditional model is certainly not suitable to process huge volumes of scalable data and cannot be accommodated by standard database servers. Moreover, the centralized system creates too much of a bottleneck while processing multiple files simultaneously.

Traditional Enterprise System View

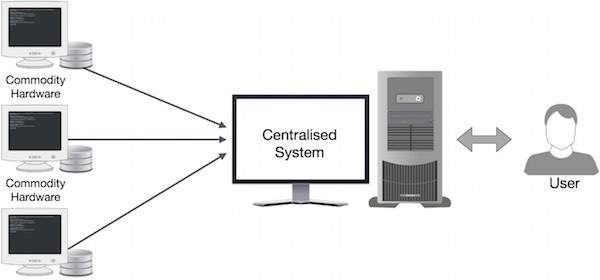
Google solved this bottleneck issue using an algorithm called MapReduce. MapReduce divides a task into small parts and assigns them to many computers. Later, the results are collected at one place and integrated to form the result dataset.

Centralized System

MapReduce-Example

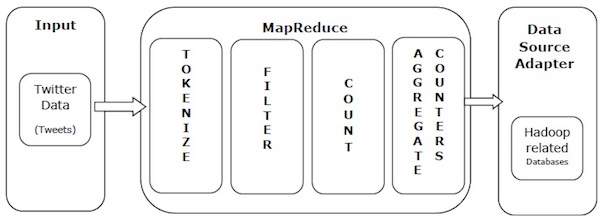
Let us take a real-world example to comprehend the power of MapReduce. Twitter receives around 500 million tweets per day, which is nearly 3000 tweets per second. The following illustration shows how Tweeter manages its tweets with the help of MapReduce.

MapReduce Example

As shown in the illustration, the MapReduce algorithm performs the following actions −

  • Tokenize − Tokenizes the tweets into maps of tokens and writes them as key-value pairs.

  • Filter − Filters unwanted words from the maps of tokens and writes the filtered maps as key-value pairs.

  • Count − Generates a token counter per word.

  • Aggregate Counters − Prepares an aggregate of similar counter values into small manageable units.

MapReduce - Algorithm

The MapReduce algorithm contains two important tasks, namely Map and Reduce.

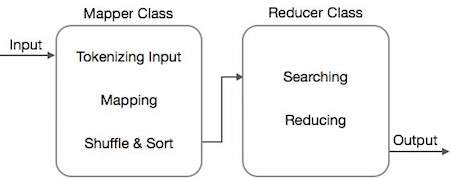
  • The map task is done by means of Mapper Class
  • The reduce task is done by means of Reducer Class.

Mapper class takes the input, tokenizes it, maps and sorts it. The output of Mapper class is used as input by Reducer class, which in turn searches matching pairs and reduces them.

Mapper Reducer Class

MapReduce implements various mathematical algorithms to divide a task into small parts and assign them to multiple systems. In technical terms, MapReduce algorithm helps in sending the Map & Reduce tasks to appropriate servers in a cluster.

These mathematical algorithms may include the following −

  • Sorting
  • Searching
  • Indexing
  • TF-IDF

Sorting

Sorting is one of the basic MapReduce algorithms to process and analyze data. MapReduce implements sorting algorithm to automatically sort the output key-value pairs from the mapper by their keys.

  • Sorting methods are implemented in the mapper class itself.

  • In the Shuffle and Sort phase, after tokenizing the values in the mapper class, the Context class (user-defined class) collects the matching valued keys as a collection.

  • To collect similar key-value pairs (intermediate keys), the Mapper class takes the help of RawComparator class to sort the key-value pairs.

  • The set of intermediate key-value pairs for a given Reducer is automatically sorted by Hadoop to form key-values (K2, {V2, V2, …}) before they are presented to the Reducer.

Searching

Searching plays an important role in MapReduce algorithm. It helps in the combiner phase (optional) and in the Reducer phase. Let us try to understand how Searching works with the help of an example.

Example

The following example shows how MapReduce employs Searching algorithm to find out the details of the employee who draws the highest salary in a given employee dataset.

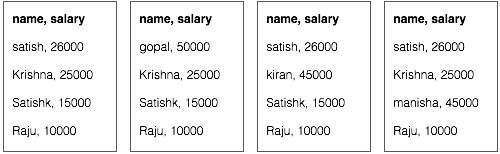
  • Let us assume we have employee data in four different files − A, B, C, and D. Let us also assume there are duplicate employee records in all four files because of importing the employee data from all database tables repeatedly. See the following illustration.

Map Reduce Illustration
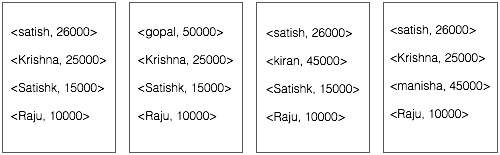
  • The Map phase processes each input file and provides the employee data in key-value pairs (<k, v> : <emp name, salary>). See the following illustration.

Map Reduce Illustration
  • The combiner phase (searching technique) will accept the input from the Map phase as a key-value pair with employee name and salary. Using searching technique, the combiner will check all the employee salary to find the highest salaried employee in each file. See the following snippet.

<k: employee name, v: salary>
Max= the salary of an first employee. Treated as max salary

if(v(second employee).salary > Max){
   Max = v(salary);
}

else{
   Continue checking;
}

The expected result is as follows −

<satish, 26000>


<gopal, 50000>


<kiran, 45000>


<manisha, 45000>


  • Reducer phase − Form each file, you will find the highest salaried employee. To avoid redundancy, check all the <k, v> pairs and eliminate duplicate entries, if any. The same algorithm is used in between the four <k, v> pairs, which are coming from four input files. The final output should be as follows −

<gopal, 50000>

Indexing

Normally indexing is used to point to a particular data and its address. It performs batch indexing on the input files for a particular Mapper.

The indexing technique that is normally used in MapReduce is known as inverted index. Search engines like Google and Bing use inverted indexing technique. Let us try to understand how Indexing works with the help of a simple example.

Example

The following text is the input for inverted indexing. Here T[0], T[1], and t[2] are the file names and their content are in double quotes.

T[0] = "it is what it is"
T[1] = "what is it"
T[2] = "it is a banana"

After applying the Indexing algorithm, we get the following output −

"a": {2}
"banana": {2}
"is": {0, 1, 2}
"it": {0, 1, 2}
"what": {0, 1}

Here "a": {2} implies the term "a" appears in the T[2] file. Similarly, "is": {0, 1, 2} implies the term "is" appears in the files T[0], T[1], and T[2].

TF-IDF

TF-IDF is a text processing algorithm which is short for Term Frequency − Inverse Document Frequency. It is one of the common web analysis algorithms. Here, the term 'frequency' refers to the number of times a term appears in a document.

Term Frequency (TF)

It measures how frequently a particular term occurs in a document. It is calculated by the number of times a word appears in a document divided by the total number of words in that document.

TF(the) = (Number of times term the ‘the’ appears in a document) / (Total number of terms in the document)

Inverse Document Frequency (IDF)

It measures the importance of a term. It is calculated by the number of documents in the text database divided by the number of documents where a specific term appears.

While computing TF, all the terms are considered equally important. That means, TF counts the term frequency for normal words like “is”, “a”, “what”, etc. Thus we need to know the frequent terms while scaling up the rare ones, by computing the following −

IDF(the) = log_e(Total number of documents / Number of documents with term ‘the’ in it).

The algorithm is explained below with the help of a small example.

Example

Consider a document containing 1000 words, wherein the word hive appears 50 times. The TF for hive is then (50 / 1000) = 0.05.

Now, assume we have 10 million documents and the word hive appears in 1000 of these. Then, the IDF is calculated as log(10,000,000 / 1,000) = 4.

The TF-IDF weight is the product of these quantities − 0.05 × 4 = 0.20.


 REF

https://www.guru99.com/introduction-to-mapreduce.html